Time to Put on the Stock Market Bear Suits?
Stock-Markets / Stock Markets 2013 Jan 20, 2013 - 03:32 PM GMT

 In previous reports I have spoke at length about expectations for the US markets to push higher above their respective September 2012 highs.
I have been looking for the DOW and SPX to push higher as we had seen many other European and US markets take out those September 2012 highs, so I felt it was only a matter of time before we saw others play catch up.
Between the last time I wrote and this report we have seen the bears fold and the bearish wave count crumble as I expected it to, but when you count an obvious 3 wave decline as a 5 wave decline you are always going to run into trouble. The sad truth is the “experts of Elliott Wave” do this sort of thing very often and it gives other Elliotticians a bad name so much that other Elliotticians such as me get tarnished under the same banner and it ruins what is still a great trading tool if it’s used in the right hands.
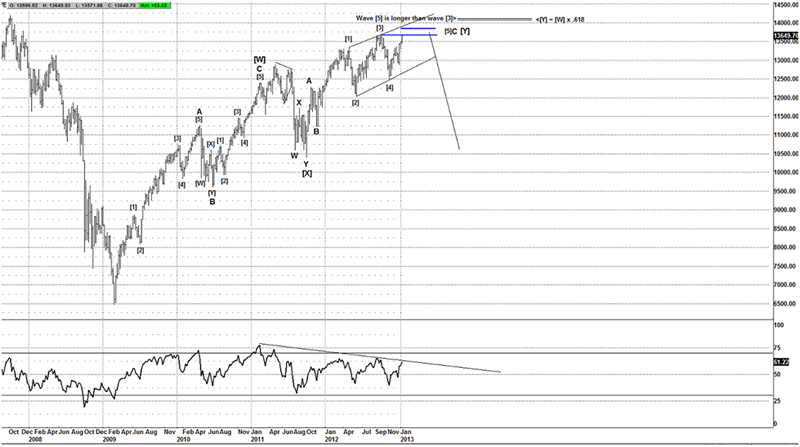
So an update to where I think we are and what I expect going forward. If you have read the last few updates, readers will know that I have remained bullish and called for prices to push higher, I have wanted and indeed expected to see the SPX and DOW exceed those September 2012 highs, with the SPX clearing that target that ticked off 1 of the remaining 2 markets I have been tracking and as of Fridays close the DOW was a 11 points off from the September highs.
So we might see a spike higher in the DOW from IBM results which are due on Tuesday.
SPX

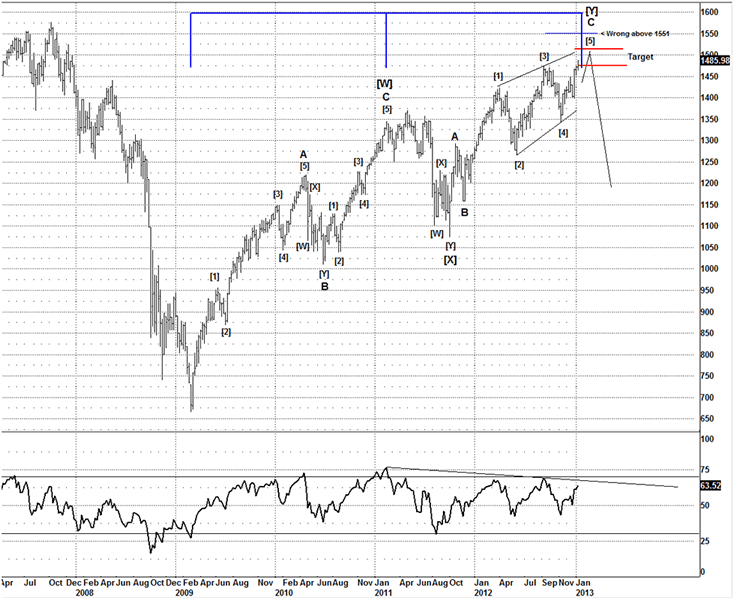
We have now hit my target range, although it can still run a bit higher as I was looking for 1480-1500SPX, based on the DOW needing to see around 13660-13700 we could push a bit higher on Tuesday.
You will note we also have a timing cycle that is also due on the 23rd Jan, so a potential timing high could be setting up this week, although we do have the bulk of earnings out this coming week so things could get very interesting.
I am still working an ending diagonal and if this interpretation is correct then once its finished I suspect we are about to see a strong decline as the market is involved in a topping phase and with the last two markets virtually at their respect targets, it’s now time to be looking for a potential major top in the markets.
Having remained bullish for a number of weeks, I am slowing dusting off the furry bear suit and potentially ready to put it on should we see some strong evidence of a reversal.
With everyone and his/her dog calling for higher this is exactly the sort of sentiment I wanted to see, in fact I would be cautious about looking lower if I never say this sort of sentiment.
We saw it at the 2010 highs, 2011 highs and 2012 highs, so why would we expect any different?
I just got one question to ask? Where were these so called pundits called for 1600 and 1700 on the SPX when the SPX was trading at 1380-1400SPX. All I can recall was the market was going to 1250SPX, or so everyone kept telling me.
Everyone is an expert calling for higher when a market has just made new highs, yet you can count on one hand the number of trader’s looking for a large move to the downside from here.
As it stands I put myself in the bearish camp at these levels, when so many are now on one side of the boat that’s the exact sort of conditions I thrive on and start looking at taking the opposite side to the majority.
I did the same at the 2010, 2011 and 2012 peaks, and it worked out well, I see the same ideas and conditions as I did back then, in fact the conditions I see now are conditions that are reminiscent of a top of a trend. Traders look higher at the highs and lower at the lows, but when I see patterns and potential setups for a reversal, that’s when I look to fade the crowd at the top of trend and at the bottom of a trend.
Many appear to forget that I have been looking for these targets so it’s no surprise that we have arrived, so to suddenly get bearish at the top of suspect trend is what many traders and investors are unable to do.
DOW

I am working the same ideas, as you expect on the DOW, but it’s lacked the extra needed push into the target zone, a little bit higher would give it a better look, so a bit higher next week would be fitting to end this idea after the majority of earnings are out.
The great thing about both the ideas on the SPX and DOW is we have clear guidelines and risk parameters where the ideas are wrong, so we can either start laying into shorts from current levels or a bit higher with risk controlled, or we can simply wait and watch to see if we see some evidence to suggest the market has topped the rally from the March 2009 low.
Either way it won’t take much to find out if we are right or wrong, I will discuss that in more detail with members. So whilst we appear to have a great setup we can always wait for some evidence of a move lower and be safe or as safe as we can and limit risk, after all that’s the most important aspect of trading, to limit your risk as the gains will take care of themselves.
Bull Case
Now it wouldn’t be fair to post only one side of the argument without suggesting what the other side is looking at.
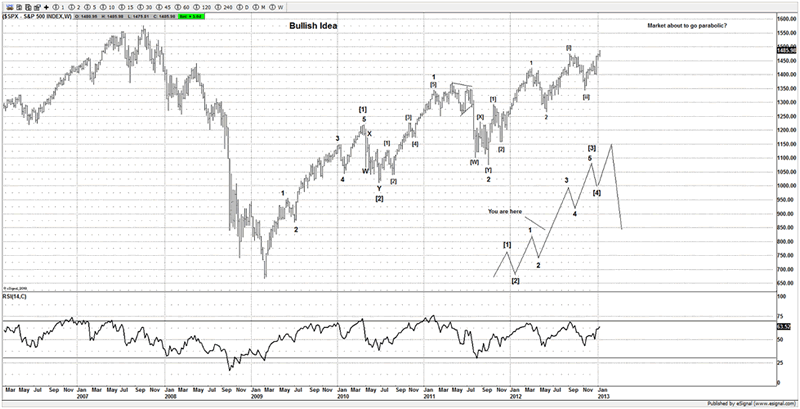
This is the only feasible bullish wave count I can realistically come up with that remains within the rules and has the “risk look”.

What you see here is something that I consider a low odds trade, as the ramifications of the next move higher in US stocks will be something that I don’t think many have took on board.
Forget 1600 or even 2000 on the SPX, try 2500SPX straight from here, as the next move is supposed to be a “3rd of 3rd” so a parabolic move to the upside, as the biggest and most strongest part of the move has yet to come.
So a near vertical move that will make the move in AAPL look like a $50 move, that’s how aggressive this wave count is.
I don’t believe you can label it any other way as I don’t see a strong 3rd wave yet and every bull cycle tends to see a strong 3rdwave, that’s how we can decide that it’s a strong impulse wave.
What we have been seeing the past 12 months is a series of waves that are overlapping, that’s the classic signature of an ending diagonal, not in my opinion of a market that is about to go parabolic to the upside.
I have to ask the question: If the market has needed 4 attempts (or is it 5?) of QE to get the market back to just underneath the prior all time highs, what is needed to take it far higher?
We are seeing each QE failing to push the market higher as the effects are weaker each time.
If we see stocks go parabolic and above 2000SPX, does anyone think that they will only go alone?
I strongly doubt that stocks will go it alone, many markets will join in, markets like Oil which probably is going to be at $150-200, Grains will likely go crazy on the upside and the US$ is likely to be crushed as hyper-inflation takes hold.
That is the scenario where I think you see a crazy spike higher in US stock as the bulls are suggesting.
Good luck on that trade, I think stocks will be the least of your worries as food riots will likely be seen as we saw the effects of what happens when markets go up in tandem, commodities join in as well.
So be careful what you wish for and the effects could be more damaging than you can imagine.
Bull or Bear we will know shortly, but as it stands I am happy to look for a reversal here and fade the crown, nothing is 100% but we have our risk parameters and we know where our ideas are wrong.
For $20 a month, come and joins us. With many of our stock ideas setting up I am sure there is a trade for everyone who trades US stocks.
Until next time
Have a profitable week ahead.
Click here to become a member
You can also follow us on twitter
What do we offer?
Short and long term analysis on US and European markets, various major FX pairs, commodities from Gold and silver to markets like natural gas.
Daily analysis on where I think the market is going with key support and resistance areas, we move and adjust as the market adjusts.
A chat room where members can discuss ideas with me or other members.
Members get to know who is moving the markets in the S&P pits*
*I have permission to post comments from the audio I hear from the S&P pits.
If you looking for quality analysis from someone that actually looks at multiple charts and works hard at providing members information to stay on the right side of the trends and making $$$, why not give the site a trial.
If any of the readers want to see this article in a PDF format.
Please send an e-mail to Enquires@wavepatterntraders.com
Please put in the header PDF, or make it known that you want to be added to the mailing list for any future articles.
Or if you have any questions about becoming a member, please use the email address above.
If you like what you see, or want to see more of my work, then please sign up for the 4 week trial.
This article is just a small portion of the markets I follow.
I cover many markets, from FX to US equities, right the way through to commodities.
If I have the data I am more than willing to offer requests to members.
Currently new members can sign up for a 4 week free trial to test drive the site, and see if my work can help in your trading and if it meets your requirements.
If you don't like what you see, then drop me an email within the 1st 4 weeks from when you join, and ask for a no questions refund.
You simply have nothing to lose.
By Jason Soni AKA Nouf
© 2013 Copyright Jason Soni AKA Nouf - All Rights Reserved
Disclaimer: The above is a matter of opinion provided for general information purposes only and is not intended as investment advice. Information and analysis above are derived from sources and utilising methods believed to be reliable, but we cannot accept responsibility for any losses you may incur as a result of this analysis. Individuals should consult with their personal financial advisors.
© 2005-2022 http://www.MarketOracle.co.uk - The Market Oracle is a FREE Daily Financial Markets Analysis & Forecasting online publication.


