


Waiting for the Stock Market to Show its Hand
Stock-Markets / Stock Markets 2013 Jan 19, 2013 - 05:15 PM GMTBy: Tony_Pallotta

 For the week ending January 18, 2013, the SPX was up 0.9%, the Russell small caps were up 1.4% and the COMP was up 0.3%.
Tech is starting to underperform large caps. There were also a few instances during the week where small caps also underperformed large caps though on the week RUT did outperform.
The model remains flat waiting for a test of support for confirmation as to whether this is the start of a new uptrend. Price always pulls back into support and that is when a trend is confirmed. It is not advised that you chase this market. Wait for a test of support for confirmation.
There are either buyers or there are not. It's really that simple. There is no sense trying to speculate beyond that test. It will come. Just need to be patient waiting for confirmation.
Support for next week is roughly 1460-1465 on SPX, 875-880 on RUT and 3090-3100 on COMP.
We continue to profile all JPY pairs (EUR, AUD and USD) as exhaustive. With the exception of AUD, there has now been ten consecutive up weeks on the weekly chart. Typically seven is the most you will see on any timeframe.
So probability favors a pullback next week. Not necessarily a trend reversal, but a healthy pullback into daily support. Should support fail and based on weekly and monthly profiles there is a high probability it will, then a sharp unwind of these pairs will fuel risk off in various asset classes. It is likely if that is to happen that equity will sell off last.
Asset Class Correlations
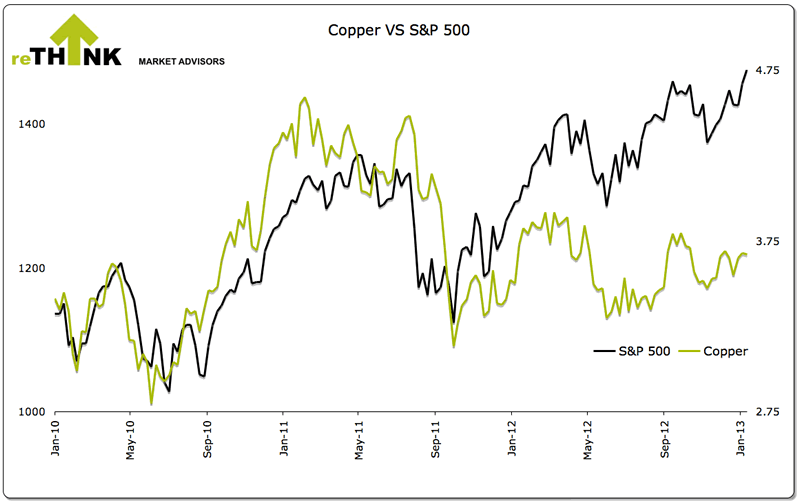
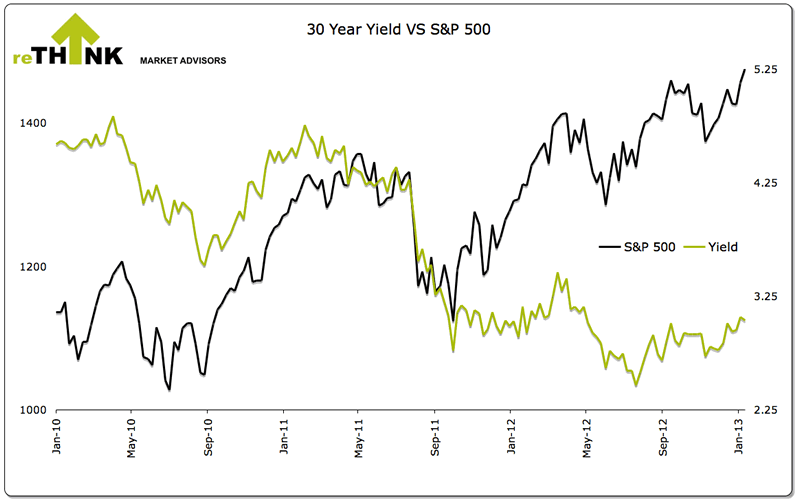
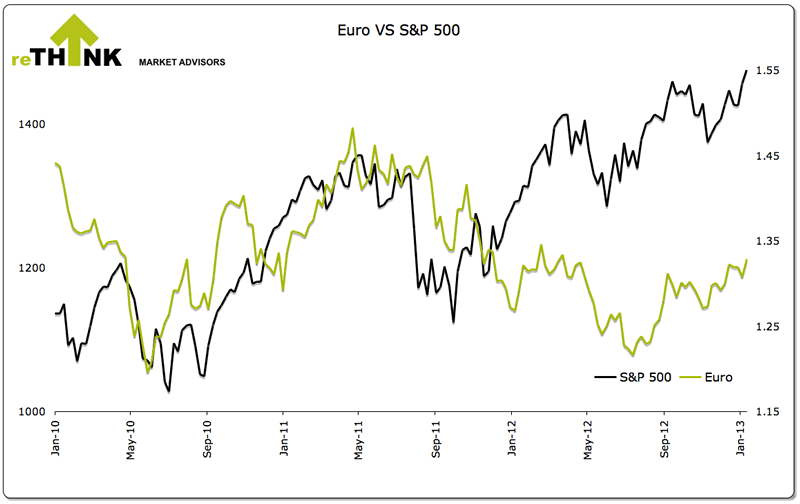
For the week ending January 18, 2013, the EUR was down 0.2%, copper was up 0.4%, 30 year yield was down 2bp and the Aussie Dollar was down 0.2%.
Copper was in a multi-week countertrend rally that was stopped out on Wednesday of this week. A test of 3.57 is probable in the coming sessions. Failure to hold that level will likely trigger short.
The dollar is close to triggering long with a sustained close above 79.95-80 and confirmed upside momentum over the coming sessions.
The multi-month divergence with equity and the EUR, AUD, copper and 30 year yield remains. As a result equity may show greater relative weakness as part of any future asset class convergence. Therefore, using any of these asset classes as a directional indicator may likely produce false signals.
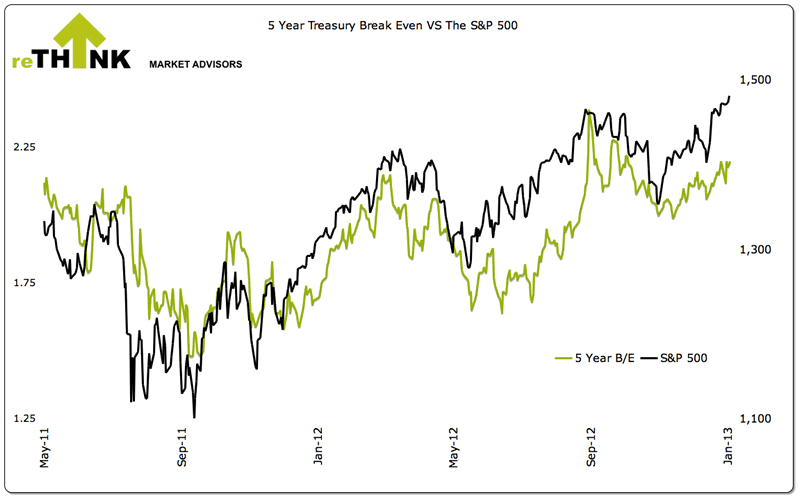
There is also a noticeable divergence with the 5 year Treasury break even as shown below which were up 2bp on the week.
Sentiment
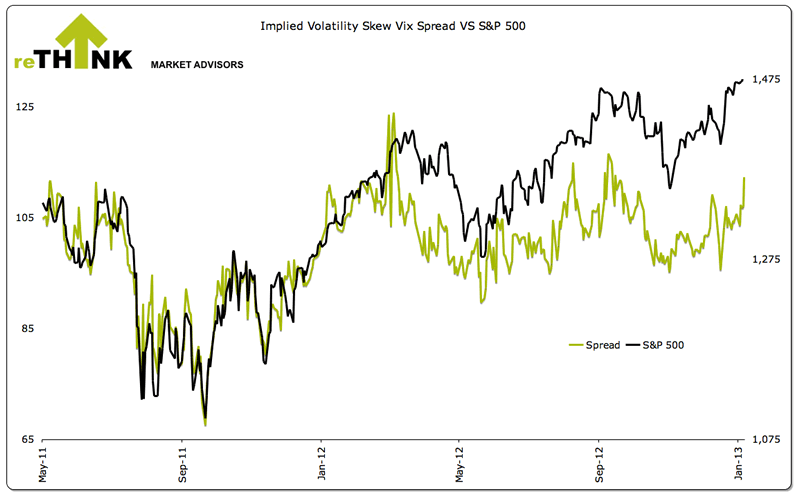
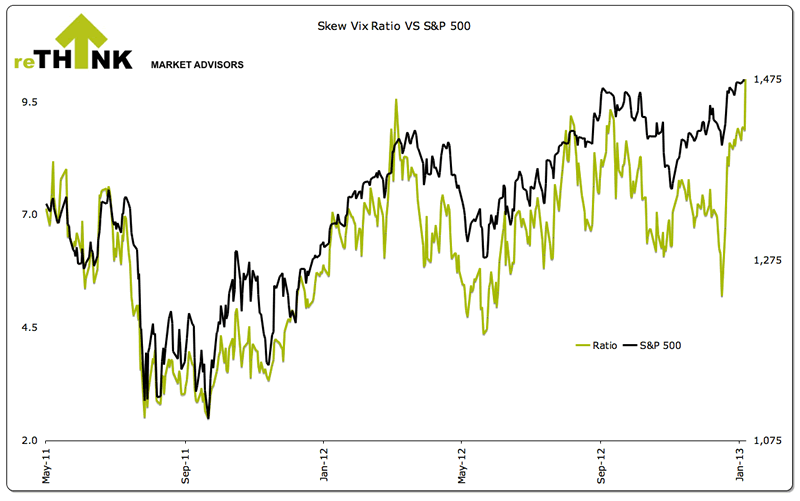
Market sentiment remains extremely complacent as viewed through the options market with the VIX at a 6 year low though implied volatility skew, averaging 120 on the week, has started to rise.
Skew is a measure of how implied volatility is distributed. The lower the reading the less skewed the curve, indicating a normalized distribution.
Funds Flow
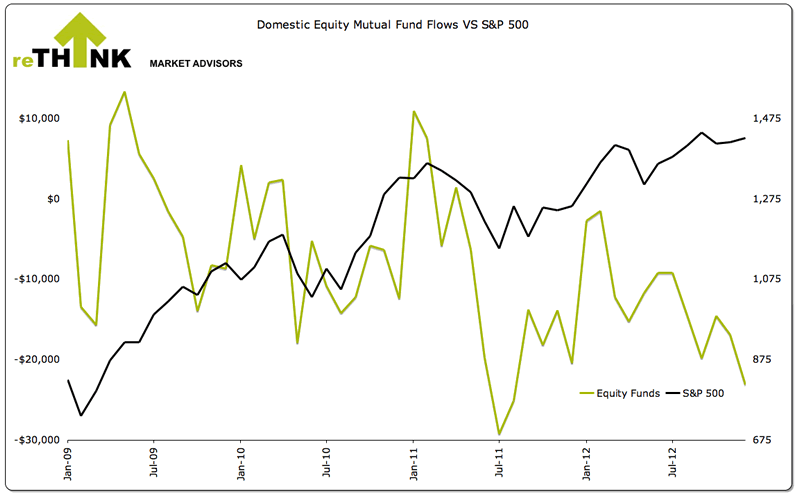
For the period ending January 10, 2013, $8.0 billion flowed in to domestic equity funds while $9.7 billion flowed in to both municipal and taxable bonds. Though there still remains a large divergence as charted below, this is the first inflow into domestic equity funds in a number of months.
For the month of December, domestic equity funds had a net outflow of $22.0 billion while bond funds had a net inflow of $9.8 billion. For 2012, domestic equity funds had a net outflow of $149.3 billion while bonds funds had a net inflow of $295.4 billion.
Bottom Line
We remain waiting for a test of support in determining future market direction. You never chase a market nor do you chase this move. At a minimum support will be tested. If that holds a new uptrend will form. If that fails, we will likely see resumption of the downtrend. There is no sense getting emotional or speculating where the market will go. Let the market show it's hand. It always does.
JPY cross pairs need to be monitored closely for any signs of an unwind. They remain highly stretched at current levels.
About The Big Picture: All technical levels and trends are based upon Rethink Market Advisor models, which are price and momentum based. They do not use trend lines nor other traditional momentum studies. To learn more about how the models work, please click here or visit http://rethink-markets.com/model-profile
© 2012 Copyright Tony Pallotta - Disclaimer: The above is a matter of opinion provided for general information purposes only and is not intended as investment advice. Information and analysis above are derived from sources and utilising methods believed to be reliable, but we cannot accept responsibility for any losses you may incur as a result of this analysis. Individuals should consult with their personal financial advisors.
Tony Pallotta Archive |
© 2005-2022 http://www.MarketOracle.co.uk - The Market Oracle is a FREE Daily Financial Markets Analysis & Forecasting online publication.