


Stock Market Uptrend Continues
Stock-Markets / Stock Markets 2013 Jan 13, 2013 - 01:15 PM GMTBy: Tony_Caldaro

 The market experienced its first noticeable pullback, since the SPX 1398 low, this week, and it was only 16 SPX points. After it completed on tuesday the market started making new uptrends highs on thursday/friday. For the week the SPX/DOW gained 0.40%, and the NDX/NAZ gained 0.85%. Asian markets lost 0.7%, European market gained 1.1%, and the DJ World index gained 0.7%. Economic reports for the week were sparse and 6 to 3 to the upside. On the downtick: the trade deficit and export/import prices. On the uptick: consumer credit, wholesale inventories, the budget deficit, the monetary base, the WLEI and weekly jobless claims improved slightly. Next week, options expiration week, we have reports on retail sales, the CPI/PPI, industrial production and the FED’s beige book. Best to your week!
LONG TERM: bull market
After dealing with a bull/bear inflection range for about two months. The SPX finally cleared that range the first week in January, and set us back onto our primary bull market count. The alternate bear count still has a 25% probability. But once the DOW clears 13,543 that count can be eliminated.
Our bullish count continues to be displayed on the weekly SPX chart. We are still expecting this bull market to unfold in five Primary waves, to complete Cycle wave [1] of the new Supercycle 3 bull market. Primary waves I and II completed in 2011 at SPX 1371 nad 1075 respectively. Primary wave III has been underway since that low. Primary wave I unfolded in five Major waves with a subdividing Major wave 1. Primary wave III appears to be following the same path, only Major wave 3 is also subdividing.
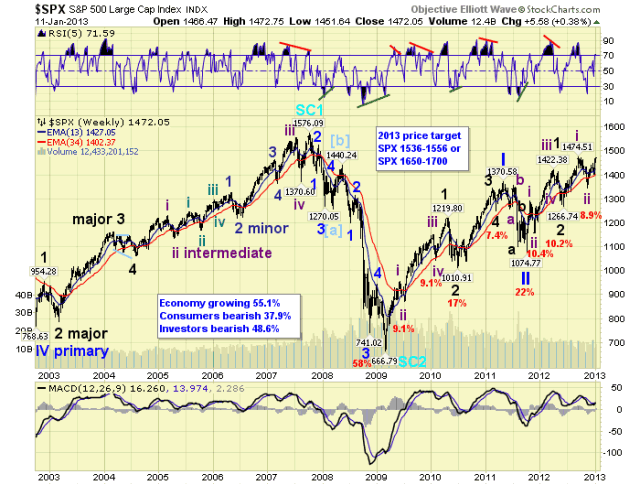
With the bull market now well advanced from the Mar09 SPX 667 low. We still anticipate at least three more uptrends, after this one concludes, before the bull market ends. Upon conclusion of this uptrend, Intermediate wave iii, a downtrending Intermediate iv would follow. Then the next uptrend would complete Major wave 3. After a Major wave 4 correction, an uptrending Major wave 5 would complete Primary III. Then after a Primary IV correction, Primary wave V should end the bull market. Our target range, for a bull market high, remains quite wide SPX 1536-1700. We should be able to narrow the range as the waves unfold.
MEDIUM TERM: uptrend
The current uptrend started in mid-Nov12 at SPX 1343. That low was within a few points of our maximum downside target of SPX 1345/46. After the low we could count a nice five waves up to SPX 1424 for Minor wave 1, but then the market started to get choppy. What eventually unfolded, likely due to the ‘fiscal cliff drama’, was an irregular Minor wave 2 flat. Irregular flats are typically bullish, and once the flat completed at SPX 1398 the market exploded to the upside to start Minor 3.
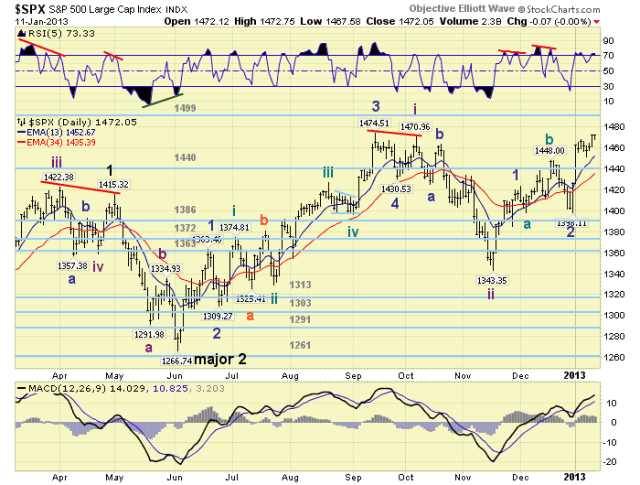
Minor wave 1 divided into five Minute waves, (see the SPX hourly chart below). Minor wave 3 is dividing into five Minute waves as well. Observe the strength of both Minute waves i. While Minor 1 had shortened Minute waves iii-v, we’re expecting Minor 3 to have much stronger Minute waves as it unfolds. Thus far it appears Minute wave i, Minor 3, was 70 points (SPX 1398-1468). Then after a small Minute wave ii pullback (SPX 1468-1452), Minute iii was underway.
We would expect this uptrend to first reach the OEW 1523 pivot during Minor 3. Then after a small Minor 4 pullback, to reach the OEW 1552 pivot before Intermediate wave iii concludes. This would allow sufficient downtrend room for Intermediate wave iv, as to not overlap Intermediate i at SPX 1475. Medium term support is at the 1440 and 1386 pivots, with resistance at the 1499 and 1523 pivots.
SHORT TERM
Short term support is at SPX 1462/64 and the 1440 pivot, with resistance at SPX 1471/75 and the 1499 pivot. Short term momentum finished the week just under overbought. The short term OEW charts remain positive from SPX 1420, with the swing level now 1458.
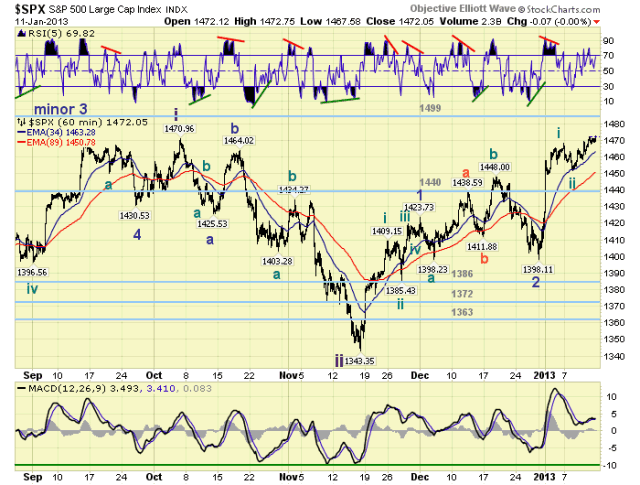
The recent Minute wave i rally was a clean five wave structure: 1418-1409-1465-1456-1468. The Minute ii pullback that followed was a nice abc: 1457-1463-1452, with ‘a’ and ‘c’ equal at 11 points each. Minute wave iii has started off a bit choppy: 1465-1458-1469-1461-1473+. But this can be expanded into a nice five wave structure should this recent rally from SPX 1461 continue higher before any notable pullback. Currently the market appears to be looking for a catalyst to move higher. Possibly next week’s plethora of economic reports and earnings will do the trick. Best to your trading!
FOREIGN MARKETS
The Asian markets were mostly lower on the week losing 0.7%. All indices are uptrending.
The European markets were mostly higher gaining 1.1%. All indices are uptrending.
The Commodity equity group were mixed gaining 0.5%. All indices are uptrending.
The uptrending DJ World index gained 0.7%.
COMMODITIES
Bonds continue to downtrend but gained 0.3% on the week.
Crude continues to uptrend gaining 0.7% on the week.
Gold continues to downtrend but gained 0.3% on the week.
The USD was uptrending but lost 1.2% on the week. The uptrend EUR gained 2.1%, and the downtrending JPYUSD lost 1.2%
NEXT WEEK
A busy economic week starts on tuesday: Retail sales, the PPI, the NY FED and Business inventories. On wednesday: the CPI, Industrial production, the NAHB, and the FED’s beige book. Thursday: weekly Jobless claims, Housing starts, Building permits and the Philly FED. Then on friday: Consumer sentiment and Options expiration. The FED has nothing scheduled at this time. Best to your weekend and week!
CHARTS: http://stockcharts.com/...
http://caldaroew.spaces.live.com
After about 40 years of investing in the markets one learns that the markets are constantly changing, not only in price, but in what drives the markets. In the 1960s, the Nifty Fifty were the leaders of the stock market. In the 1970s, stock selection using Technical Analysis was important, as the market stayed with a trading range for the entire decade. In the 1980s, the market finally broke out of it doldrums, as the DOW broke through 1100 in 1982, and launched the greatest bull market on record.
Sharing is an important aspect of a life. Over 100 people have joined our group, from all walks of life, covering twenty three countries across the globe. It's been the most fun I have ever had in the market. Sharing uncommon knowledge, with investors. In hope of aiding them in finding their financial independence.
Copyright © 2013 Tony Caldaro - All Rights Reserved Disclaimer: The above is a matter of opinion provided for general information purposes only and is not intended as investment advice. Information and analysis above are derived from sources and utilising methods believed to be reliable, but we cannot accept responsibility for any losses you may incur as a result of this analysis. Individuals should consult with their personal financial advisors.
Tony Caldaro Archive |
© 2005-2022 http://www.MarketOracle.co.uk - The Market Oracle is a FREE Daily Financial Markets Analysis & Forecasting online publication.