Stock Market Looks Set to Correct into February
Stock-Markets / Stock Markets 2013 Jan 07, 2013 - 05:19 AM GMTBy: Andre_Gratian
 SPX: Very Long-term trend - The very-long-term cycles are down and, if they make their lows when expected (after this bull market is over) there will be another steep and prolonged decline into late 2014. It is probable, however, that the severe correction of 2007-2009 will have curtailed the full downward pressure potential of the 120-yr cycle.
SPX: Intermediate trend - SPX made a top at 1474 and is engaged in an A-B-C intermediate correction. The structure has been altered by the fiscal cliff resolution rally.
Analysis of the short-term trend is done on a daily basis with the help of hourly charts. It is an important adjunct to the analysis of daily and weekly charts which discusses the course of longer market trends.
Market Overview
The temporary resolution of the fiscal cliff dilemma by the warring political parties led to a 68-point rally, but it looked as if it was beginning to run out of steam by Friday's close. With the SPX rising past 1448 last week, the A-B-C pattern proposed earlier is being modified and it is possible that the intermediate correction ended at 1398 with an early bottoming of the 66-wk cycle. A pull-back is still expected into early February, but since the SPX may not have completed its distribution phase, it is chancy to attempt making a valid P&F projection.
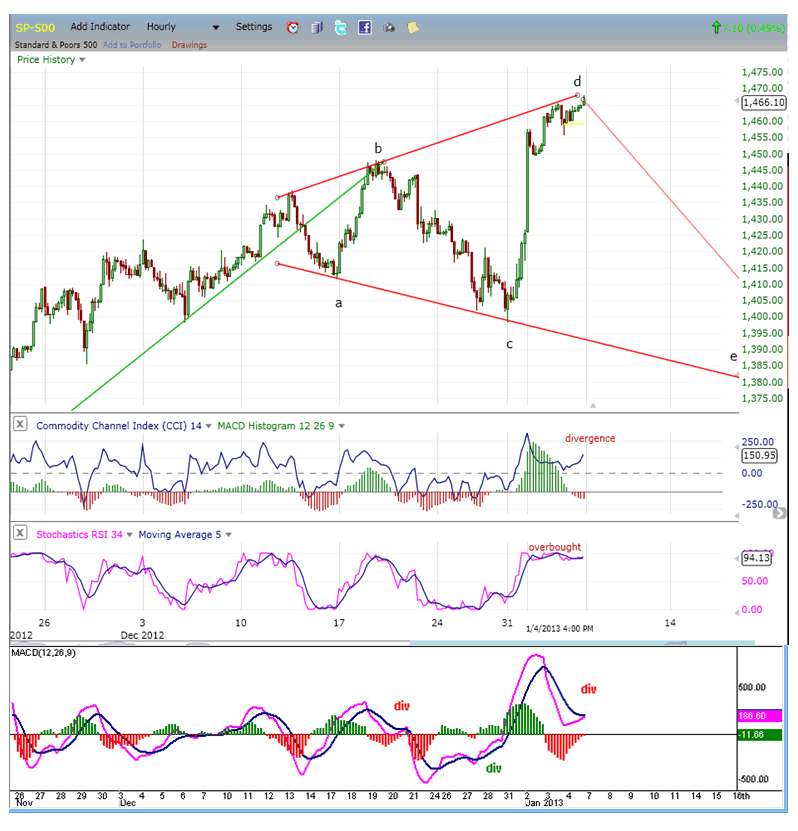
The intermediate correction was expected to conclude with a final leg down into early February. If this is still the case, the chart pattern that would best fit that time frame would be an expanding triangle. This possibility does exist and is best seen on the SPX hourly chart, below.
Chart Analysis
For this pattern to be valid, the first requirement would be that the rally in SPX concluded on Friday at 1468. In fact there was a projection made for the move to end at about 1464 several weeks ago. A review of this target using a combination of P&F, Fibonacci and pivots places the top between 1464 and 1472. The index reached this projection zone near the close, on Friday, with significant price deceleration leading to important negative divergence in the A/D and momentum indicators. That would imply that a short-term top is being made, forecasting Monday as a down day.
At the same time that SPX was meeting its target, other leading indices which were still in an uptrend (such as XLF and IWM) also reached theirs, and VIX dropped below 14, an oversold level from which, in the past, it has rallied while the market declined. In fact, its momentum indicators are the exact opposite of the SPX's, showing strong positive divergence. We should also note that NDX reached its high point on Thursday and appears to be waiting for SPX to complete its move, during which time it has created a H&S pattern.
In order to give a near-term sell signal, the SPX would have to close below 1455 on an hourly basis. But that's only the first requirement to start a downtrend. If (and it's a big "if") the proposed pattern is to be realized, significant weakness will have to develop over the next month with an estimated end to the decline perhaps as low as 1386.
The potential expanded triangle pattern does not show as well on the daily chart but, if it should unfold as proposed, 1286 (a pivot point, a valid P&F projection, and a ball park Fib target) would complete the intermediate A-B-C correction in this form instead of the one originally anticipated. What makes this pattern possible is that there is a cycle cluster due to take prices down into early February. The unknown is whether it will be able to produce enough weakness to take the SPX down to that level. Whether or not it is reached, a significant pull-back is expected before the SPX is in a position to resume its uptrend.
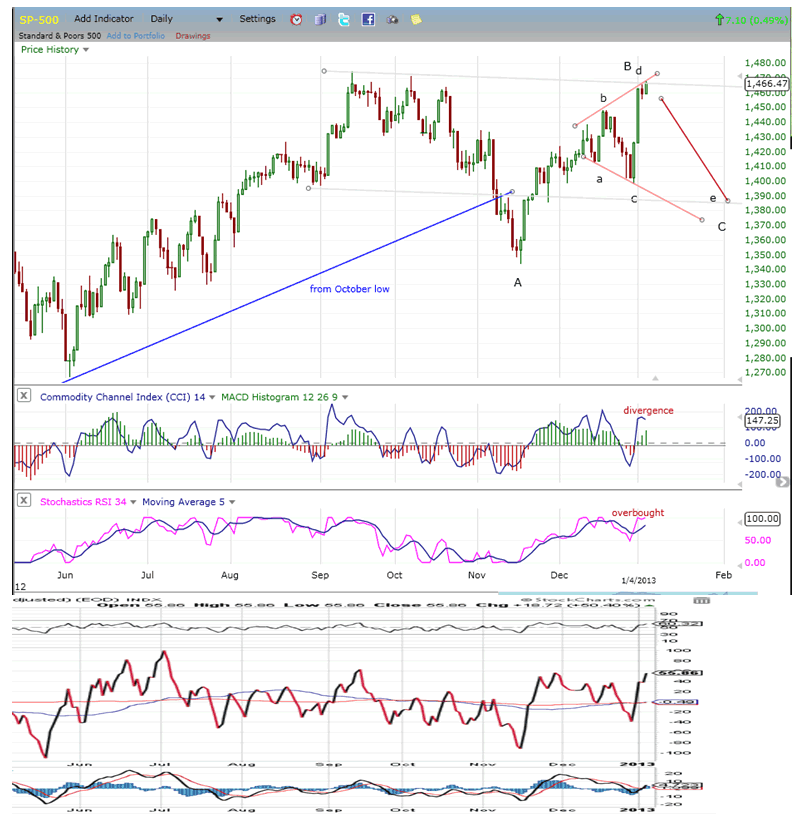
The daily indicators also add credibility to a top being made on Friday. The momentum indicators show the same overbought negative divergence patterns as the hourly ones, and the NYMO does as well. It has risen to -- but not surpassed - a level which has previously produced resistance, and is showing negative divergence. This is especially apparent in its MACD. Everything considered, this is a price level from which the SPX should retrace. The question is: "by how much?"
Cycles
From last week: "There is also a 3-wk cycle which is due to bottom in a couple of days and could very well have made its low early, on Friday."
This turned out to be correct, but the rally was far too strong to be caused by this minor cycle alone. What is likely is that the 66-wk cycle reversal was triggered early by the fiscal cliff resolution which produced a spurt of buying and short-covering euphoria.
Next should come a retracement into the cycle cluster due at the beginning of February.
Breadth
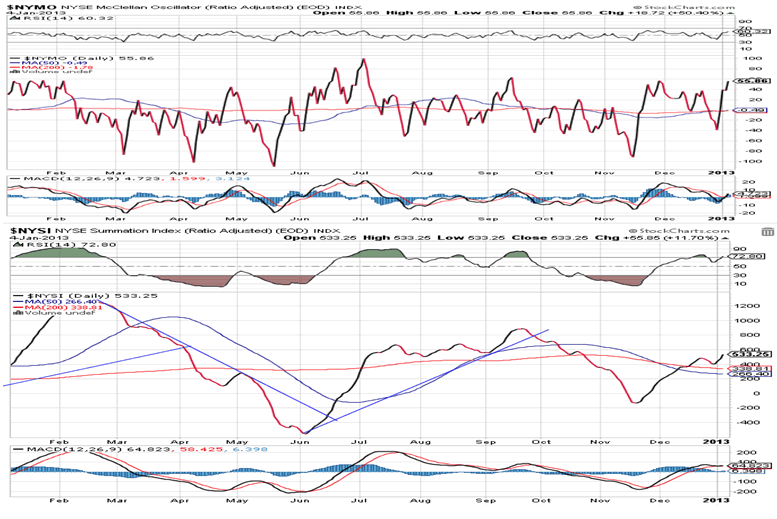
I posted the McClellan Oscillator (courtesy of StockCharts.com) below the daily chart to show how it matched up with prices. I am reproducing it here also so that we can see how it has affected the Summation Index. Actually, the NYSI does little to clarify the market position. With the strength in the NYMO, it has turned back up, which has caused a smidgen of negative divergence in its RSI. Its MACD also failed to respond to the up-move, but we'll need to see what happens next to the NYMO. If it drops back into negative territory, it will turn the NYSI down again, but in order to confirm the suggested price pattern, the NYSI RSI would have to drop down from its moderately overbought level all the way down into oversold.
Sentiment Indicators
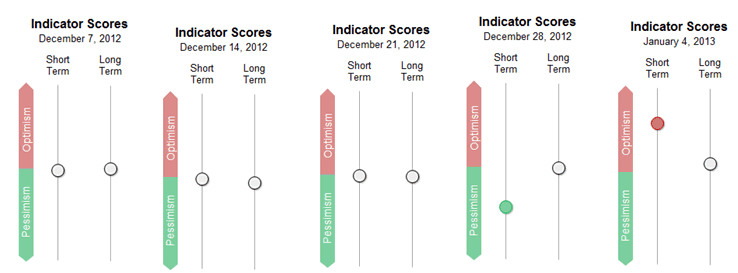
The long-term indicator of the SentimenTrader (courtesy of same) has moved very little. The real move has taken place in the short-term one which has gone from bullish to bearish. That would be another indication that the market is ready to correct. It does not tell us by how much.
VIX
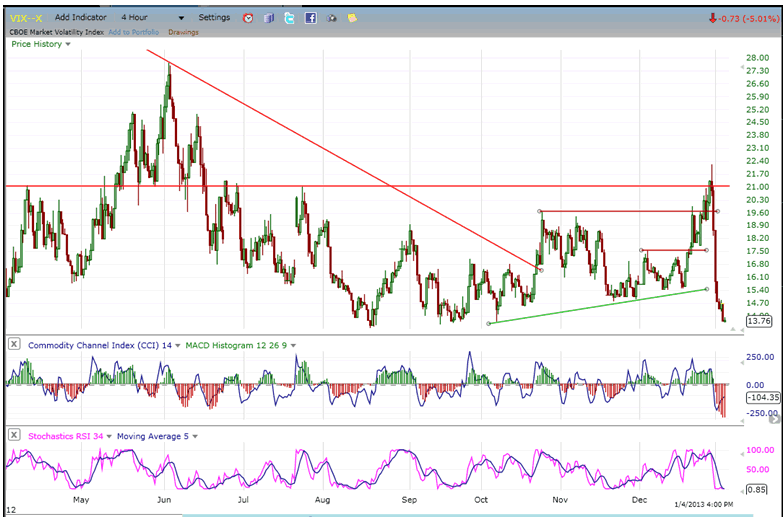
The S&P "volatility" index lived up to its name this past week, suffering one of its steepest and fastest drops in history to an oversold level from which it normally rallies with the stock market going in the opposite direction. As I have mentioned before, I look for reversals in the SPX when VIX diverges from S&P on a near-term basis. This took place in the last portion of the day on Friday when SPX kept on rising into the close, while VIX held on to the low it made four hours earlier.
While this does not seem significant after the drop suffered by VIX during the week, I have come to respect these divergences -- no matter how insignificant they are -- especially when confirmed by near-term reversal signals given by other lead indicators, and the negative divergence patterns universally displayed by all the hourly charts indicators.
It is important to note that XIV (the reverse VIX) is displaying strong relative weakness to the SPX on a weekly basis, stopping well short of its 12/18 high while SPX rose well beyond 1448.
XLF (Financial SPDR)
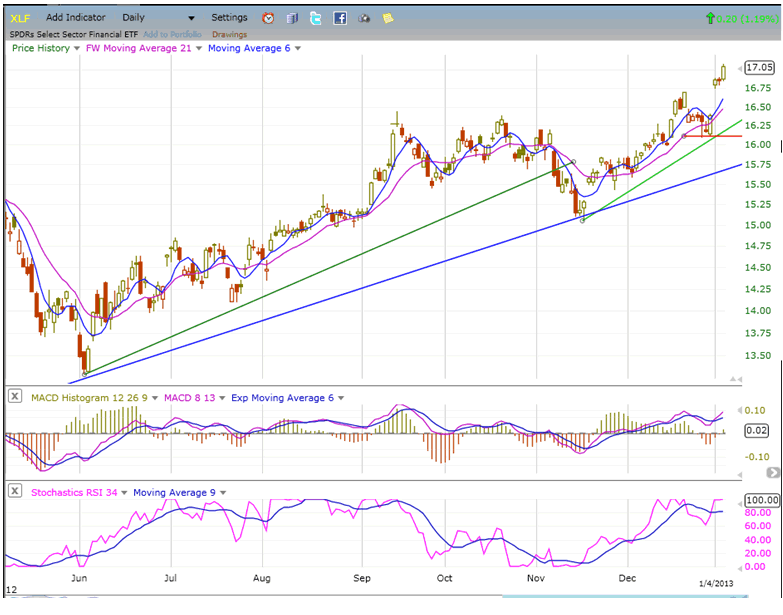
XLF could be an interesting index to observe in the future. The financial stocks have been some of the best performers in 2012 but, to put things in their proper perspective, the financial sector was one of the most beaten down groups in the last bear market. XLF, which just closed Friday at 17.05, traded as high 38 during 2007 and was pummelled down to 6 in 2009 so, even though XLF has shown some relative strength vs. the SPX in the past few weeks, this is illusory from a long-term perspective. It is only playing catch-up and still trailing far behind!
What makes this index interesting is that it has just completed a P&F projection to 17 on a short to intermediate duration and, although it may eventually get to 20 by the end of the bull market, its most likely short-term action will be to correct and consolidate instead of continuing to outperform. That should be a short-term drag on the SPX which is replete with financial stocks.
BONDS
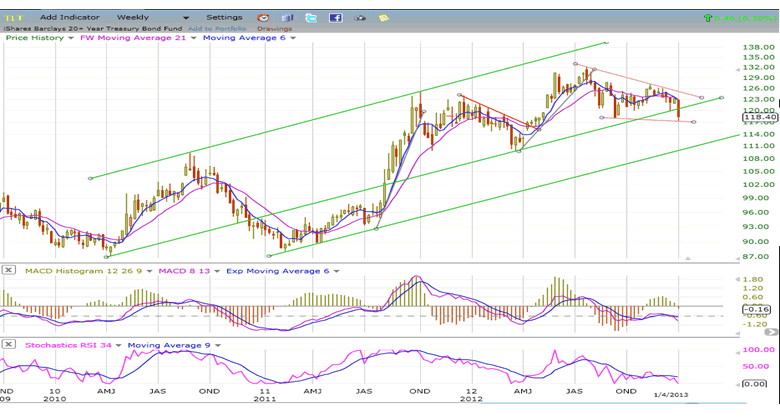
TLT has been in a corrective pattern ever since it made its high at 132 this past July. Since 118 was a short-term P&F projection, the index should consolidate and attempt to reverse its trend.
As the chart shows, the long-term is still up, but if TLT cannot rise above 128 in the near future, the pattern between the current level and 132 will begin to look like a phase of distribution capable of dropping the index down to 112 and lower. This, of course, would be over a long term period and probably in conjunction with a rise in interest rates.
Already, by breaking below is former short-term low, TLT may have started to establish a long-term downtrend which will be confirmed if it continues below 110.
GLD (ETF for gold)
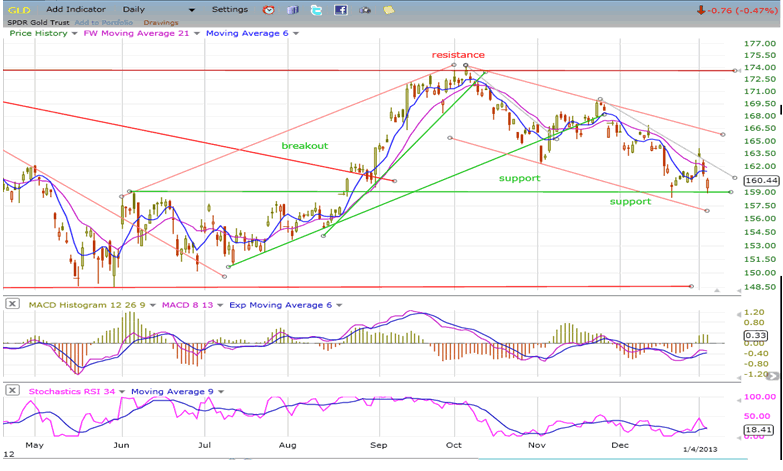
GLD rallied up to 164 and to its 200 DMA after meeting its 159 projection and is now re-testing that level. There is still a chance that it could go to 157 before starting another uptrend. On the other hand, the daily indicators are showing some good positive divergence, so it could build a base at its current level, especially now that the 25-wk cycle has made its low and the 9-wk is in the process of doing so.
UUP (dollar ETF)
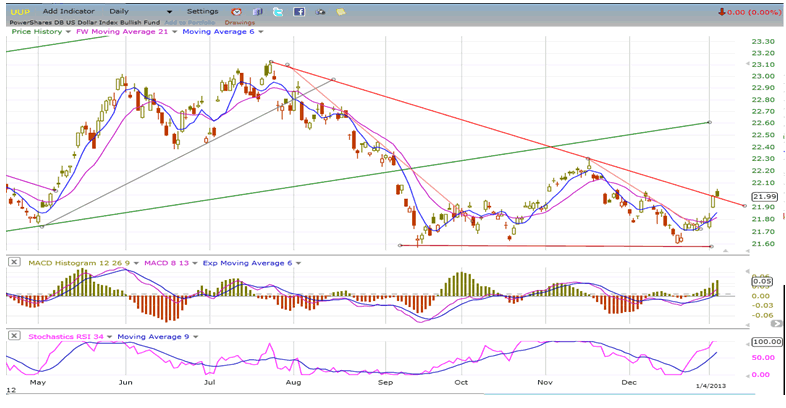
UUP has probably come to an intermediate low and is ready to continue the long-term uptrend which started in July 2011. I have maintained all along that UUP was (eventually) heading for 25, which would put the USD at 90. It's going to be a slow process, but nothing that has happened has caused me to modify this forecast.
USO (United States Oil Fund)
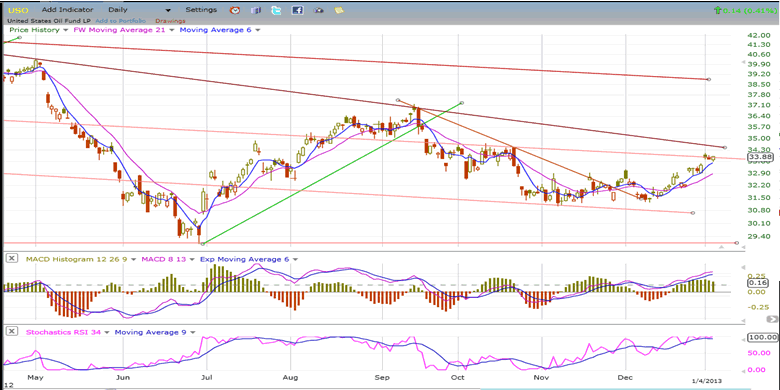
USO continues its consolidation and has come to a resistance area which should turn it back down to re-test its recent low. If it can hold the 31 level, it may be ready for an attempt at challenging its intermediate-term downtrend line of 35. But even if it is successful at overcoming it, it faces formidable odds against being able to resume a long-term uptrend. There are lower counts down to 28 and even lower, but they do not have to be filled immediately.
Summary
As expected, 1398 held, but a much stronger rally than anticipated carried the SPX beyond 1448 to a previous projection of 1464 (which had already been relegated to the archives). This move has altered the proposed intermediate corrective structure, and a new one is emerging which is detailed above as a possibility.
However the intermediate correction concludes, another decline into early February is expected.
FREE TRIAL SUBSCRIPTON
If precision in market timing for all time framesis something that you find important, you should
Consider taking a trial subscription to my service. It is free, and you will have four weeks to evaluate its worth. It embodies many years of research with the eventual goal of understanding as perfectly as possible how the market functions. I believe that I have achieved this goal.
For a FREE 4-week trial, Send an email to: ajg@cybertrails.com
For further subscription options, payment plans, and for important general information, I encourage
you to visit my website at www.marketurningpoints.com. It contains summaries of my background, my
investment and trading strategies, and my unique method of intra-day communication with
subscribers. I have also started an archive of former newsletters so that you can not only evaluate past performance, but also be aware of the increasing accuracy of forecasts.
Disclaimer - The above comments about the financial markets are based purely on what I consider to be sound technical analysis principles uncompromised by fundamental considerations. They represent my own opinion and are not meant to be construed as trading or investment advice, but are offered as an analytical point of view which might be of interest to those who follow stock market cycles and technical analysis.
Andre Gratian Archive |
© 2005-2022 http://www.MarketOracle.co.uk - The Market Oracle is a FREE Daily Financial Markets Analysis & Forecasting online publication.


