


Present Crisis Pattern, End of the Third Industrial Revolution
Economics / Economic Theory Dec 24, 2012 - 04:16 PM GMTBy: Submissions

 Wim Grommen writes: This paper advances a hypothesis of the end of the third industrial revolution and the beginning of a new transition. Every production phase or civilization or human invention goes through a so- called transformation process. Transitions are social transformation processes that cover at least one generation. In this paper I will use one such transition to demonstrate the position of our present civilization. When we consider the characteristics of the phases of a social transformation we may find ourselves at the end of what might be called the third industrial revolution. The paper describes the four most radical transitions for mankind and the effects for mankind of these transitions: the Neolithic transition, the first industrial revolution, the second industrial revolution and the third industrial revolution.
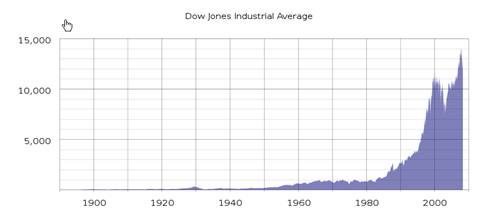
The Dow Jones Industrial Average (DJIA) Index is the only stock market index that covers both the second and the third industrial revolution. Calculating share indexes such as the Dow Jones Industrial Average and showing this index in a historical graph is a useful way to show which phase the industrial revolution is in. Changes in the DJIA shares basket, changes in the formula and stock splits during the take-off phase and acceleration phase of industrial revolutions are perfect transition-indicators. The similarities of these indicators during the last two revolutions are fascinating, but also a reason for concern. In fact the graph of the DJIA is a classic example of fictional truth, a fata morgana.
History has shown that five pillars are essential in a stable society: Food, Security, Health, Prosperity and Knowledge. At the end of every transition the pillar Prosperity is threatened. We have seen this effect at the end of every industrial revolution. Societies will have to make a choice for a new transition to be started.
Keywords: transition, industrial revolution, S curve, Dow Jones Industrial Average, stocks,
share price / income ratio, five pillars, Prosperity
INTRODUCTION
Every production phase or civilization or other human invention goes through a so called transformation process. Transitions are social transformation processes that cover at least one generation. In this paper I will use one such transition to demonstrate the position of our present civilization. When we consider the characteristics of the phases of a social transformation we may find ourselves at the end of what might be called the third industrial revolution. Transitions are social transformation processes that cover at least one generation (= 25 years).
A transition has the following characteristics:
- it involves a structural change of civilization or a complex subsystem of our civilization
- it shows technological, economical, ecological, socio cultural and institutional changes at
different levels that influence and enhance each other
- it is the result of slow changes (changes in supplies) and fast dynamics (flows)
Examples of historical transitions are the demographical transition and the transition from coal to natural gas which caused transition in the use of energy. A transition process is not fixed from the start because during the transition processes will adapt to the new situation. A transition is not dogmatic.
TRANSITIONS
In general transitions can be seen to go through the S curve and we can distinguish four phases (figure 1):
- a pre-development phase of a dynamic balance in which the present status does not visibly change
- a take-off phase in which the process of change starts because of changes in the system
- an acceleration phase in which visible structural changes take place through an accumulation of socio-cultural, economical, ecological and institutional changes influencing each other; in this phase we see collective learning processes, diffusion and processes of embedding
- a stabilization phase in which the speed of sociological change slows down and a new dynamic balance is achieved through learning
A product life cycle also goes through an S curve. In that case there is a fifth phase:
the degeneration phase in which cost rises because of over capacity and the producer will finally withdraw from the market.
Figure 1. The S curve of a transition
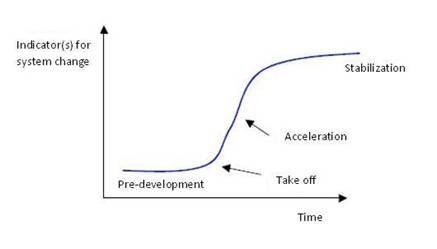
Four phases in a transition best visualized by means of an S curve:
Pre-development, Take-off, Acceleration, Stabilization.
The process of the spreading of transitions over civilizations is influenced by a number of elements:
- physical barriers: oceans, deserts, mountain ranges, swamps, lakes
- socio cultural barriers: difference in culture and languages
- religious barriers
- psychological barriers
When we look back over the past, we see four transitions taking place with far-reaching effects.
THE NEOLITHIC TRANSITION
The Neolithic transition was the most radical transition for mankind. This first agricultural revolution (10000 – 3000 BC) forms the change from societies of hunter gatherers (20 – 50 people) close to water with a nomadic existence to a society of people living in settlements growing crops and animals. A hierarchical society came into existence. Joint organizations protected and governed the interests of the individual. Performing (obligatory) services for the community could be viewed as a first type of taxation. Stocks were set up with stock management, trade emerged, inequality and theft. Ways of administering justice were invented to solve conflicts within and between communities and war became a way of protecting interests.The Neolithic revolution started in those places that were most favorable because of the climate and sources of food. In very cold, very hot or dry areas the hunter gatherer societies lasted longer.
Several areas are pointed out as possible starting points: southern Anatolia, the basins the Yangtze Kiang and Yellow river in China, the valley of the Indus, the present Peru in the Andes or what is now Mexico in Central America. From these areas the revolution spread across the world. The start of the Neolithic era and the spreading process are different in each area. In some areas the changes are relatively quick and some authors therefore like to speak of a Neolithic revolution. Modern historians prefer to speak of the Neolithic evolution. They have come to realize that in many areas the process took much longer and was much more gradual than they originally thought.
THE FIRST INDUSTRIAL REVOLUTION
The first industrial revolution lasted from around 1780 tot 1850. It was characterized by a transition from small scale handwork to mechanized production in factories. The great catalyst in the process was the steam engine which also caused a revolution in transport as it was used in railways and shipping. The first industrial revolution was centered around the cotton industry. Because steam engines were made of iron and ran on coal, both coal mining and iron industry also flourished.
Britain was the first country that faced the industrial revolution. The steam engine was initially mainly used to power the water pumps of mines. A major change occurred in the textile industry. Because of population growth and colonial expansion the demand for cotton products quickly increased. Because spinners and weavers could not keep up with the demand, there was an urgent need for a loom with an external power unit, the power loom.
A semi-automatic shuttleless loom was invented, and a machine was created that could spin several threads simultaneously. This “Spinning Jenny”, invented in 1764 by James Hargreaves, was followed in 1779 by a greatly improved loom: ‘Mule Jenny’. At first they were water-powered, but after 1780 the steam engine had been strongly improved so that it could also be used in the factories could be used as a power source. Now much more textiles could be produced. This was necessary because in 1750, Europe had 130 million inhabitants, but in 1850 this number had doubled, partly because of the agricultural revolution. (This went along with the industrial revolution; fertilizers were imported, drainage systems were designed and ox was replaced by the horse. By far the most important element of the agricultural revolution was the change from subsistence to production for the market.). All those people needed clothing. Thanks to the machine faster and cheaper production was possible and labor remained cheap. The textile industry has been one of the driving forces of the industrial revolution.
Belgium becomes the first industrialized country in continental Europe. Belgium is “in a state of industrial revolution” under the rule of Napoleon Bonaparte. The industrial centers were Ghent (cotton and flax industries), Verviers (mechanized wool production), Liège (iron, coal, zinc, machinery and glass), Mons and Charleroi. On the mainland, France and Prussia followed somewhat later. In America the northeastern states of the United States followed quickly.
After 1870 Japan was industrialized as the first non-Western country. The rest of Europe followed only around 1880.
The beginning of the end of this revolution was in 1845 when Friedrich Engels, son of a German textile baron, described the living conditions of the English working class in “The condition of the working class in England“.
THE SECOND INDUSTRIAL REVOLUTION
The second industrial revolution started around 1870 and ended around 1930. It was characterized by ongoing mechanization because of the introduction of the assembly line, the replacement of iron by steel and the development of the chemical industry. Furthermore coal and water were replaced by oil and electricity and the internal combustion engine was developed. Whereas the first industrial revolution was started through (chance) inventions by amateurs, companies invested a lot of money in professional research during the second revolution, looking for new products and production methods. In search of finances small companies merged into large scale enterprises which were headed by professional managers and shares were put on the market. These developments caused the transition from the traditional family business to Limited Liability companies and multinationals.
The United States (U.S.) and Germany led the way in the Second Industrial Revolution. In the U.S. there were early experiments with the assembly line system, especially in the automotive industry. In addition, the country was a leader in the production of steel and oil. In Germany the electricity industry and the chemical industry flourished. The firms AEG and Siemens were electricity giants. German chemical companies such as AGFA and BASF had a leading share in the production of synthetic dyes, photographic and plastic products (around 1900 they controlled some 90% of the worldwide market). In the wake of these two industrial powers (which soon surpassed Britain) France, Japan and Russia followed. After the Second Industrial Revolution more and more countries, on more continents, experienced a more or less modest industrial development. In some cases, the industrialization was taken in hand by the state, often with coarse coercion – such as the five-year plans in the Soviet Union.
After the roaring twenties the revolution ended with the stock exchange crash of 1929. The consequences were disastrous culminating in the Second World War.
THE THIRD INDUSTRIAL REVOLUTION
The third industrial revolution started around 1940 and is nearing its end. The United States and Japan played a leading role in the development of computers. During the Second World War great efforts were made to apply computer technology to military purposes. After the war the American space program increased the number of applications. Japan specialized in the use of computers for industrial purposes such as the robot.
From 1970 the third industrial revolution continued to Europe. The third industrial revolution was mainly a result of a massive development of microelectronics: electronic calculators, digital watches and counters, the compact disc, the barcode etc. The take off phase of the third industrial revolution started around 1980 with the advent of the microprocessor. The development of the microprocessor is also the basis of the evolution and breakthrough of computing. This had an impact in many areas: for calculation, word processing, drawing and graphic design, regulating and controlling machines, simulating processes, capturing and processing information, monetary transactions and telecommunications. The communication phase grows enormously at the beginning of the new millennium: the digital revolution. According to many analysts now a new era has emerged: that of the information or service economy. Here the acquisition and channeling of information has become more important than pure production. By now computer and communication technology take up an irreplaceable role in all parts of the world. More countries depend on the service sector and less on agriculture and industry.
EFFECTS OF THREE INDUSTRIAL REVOLUTIONS
The first (and second revolution) transformed an agricultural society into an industrial society where mechanization (finally) relieved man of physical labor. The craft industry could not compete with the factories that put products of the same or even better quality on the market at a lower price. The result was that many small businesses went bankrupt and the former workers went to work in the factories. The effects of industrialization were seen in the process of rapid urbanization of formerly relatively small villages and towns where the new plants came. These turned into dirty and unhealthy industrial cities. Still people from the country were forced to go and work there. Because of this a new social class emerged: the workers, or the industrial proletariat. They lived in overcrowded slums in poor housing with little sanitation. The average life expectancy was low, and infant mortality high. The elite accepted the filth of the factories as the inevitable price for their success. The chimneys were symbols of economic power, but also of social inequality. You see this social inequality appear after each revolution. The gap between the bottom and the top of society becomes very large. Eventually there are inevitable responses that decrease this gap. It could be argued that the Industrial revolutions have created the conditions for a society with little or no poverty.
The third revolution transformed an industrial society into a service society. Where mechanization man relieved of physical labor, the computer relieved him of mental labor. This revolution made lower positions in industry more and more obsolete and caused the emergence of entirely new roles in the service sector.
INDUSTRIAL REVOLUTIONS AND STOCK MARKET INDICES
The Dow Jones Industrial Average was first published halfway through the second Industrial Revolution, in 1896. The Dow Jones Industrial Average Index is the oldest stock index in the United States. This was a straight average of the rates of twelve shares. A select group of journalists from The Wall Street Journal decide which companies are part of the most influential index in the world market. Unlike most other indices the Dow is a price-weighted index. This means that stocks with high absolute share price have a significant impact on the movement of the index.
Figure 2. Exchange rates of Dow Jones Industrial Average during the latest two industrial revolutions. During the last few years the rate increases have accelerated enormously.
The S & P Index is a market capitalization weighted index. The 500 largest U.S. companies as measured by their market capitalization are included in this index, which is compiled by the credit rating agency Standard & Poor’s.
Figure 3. Third industrial revolution and the S&P 500
WHAT DOES A STOCK EXCHANGE INDEX LIKE DOW JONES OR S&P 500 REALLY MEAN?
In many graphs the y-axis is a fixed unit, such as kg, meter, liter or euro. In the graphs showing the stock exchange values, this also seems to be the case because the unit shows a number of points. However, this is far from true! An index point is not a fixed unit in time and does not have any historical significance. Unfortunately many people attach a lot of value to these graphs which are, however, very deceptive.
An index is calculated on the basis of a set of shares. Every index has its own formula and the formula results in the number of points of the index. However, this set of shares changes regularly. For a new period the value is based on a different set of shares. It is very strange that these different sets of shares are represented as the same unit.
After a period of 25 years the value of the original set of apples is compared to the value of a set of pears. At the moment only 6 of the original 30 companies that made up the set of shares of the Dow Jones at the start of the take-off phase of the last revolution are still present.
Even more disturbing is the fact that with every change in the set of shares used to calculate the number of points, the formula also changes. This is done because the index which is the result of two different sets of shares at the moment the set is changed, must be the same for both sets at that point in time. The index graphs must be continuous lines. For example, the Dow Jones is calculated by adding the shares and dividing the result by a number. Because of changes in the set of shares and the splitting of shares the divider changes continuously. At the moment the divider is 0.132319125 but in 1985 this number was higher than 1. An index point in two periods of time is therefore calculated in different ways:
Dow1985 = (x1 + x2 + ……..+x30) / 1
Dow2012 = (x1 + x2 + …….. + x30) / 0,132319125
In the nineties of the last century many shares were split. To make sure the result of the calculation remained the same both the number of shares and the divider changed. An increase in share value of 1 dollar of the set of shares in 2012 results is 7.5 times more points than in 1985. The fact that in the 1990-ies many shares were split is probably the cause of the exponential growth of the Dow Jones index. At the moment the Dow is at 13207 points. If we used the 1985 formula it would be at 1760 points.
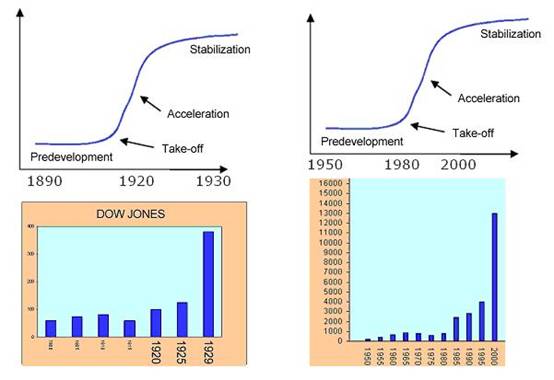
The most remarkable characteristic is of course the constantly changing set of shares in during the take-off and acceleration phase of a revolution. Generally speaking, the companies that are removed from the set are in a stabilization or degeneration phase. Companies in a take-off phase or acceleration phase are added to the set. This greatly increases the chance that the index will rise rather than go down. This is obvious, especially when this is done during the acceleration phase of a transition. From 1980 onward 7 ICT companies (3M, AT&T, Cisco, HP, IBM, Intel, Microsoft), the engines of the latest revolution were added to the Dow Jones and 5 financial institutions, which always play an important role in every revolution.
This is actually a kind of pyramid scheme. All goes well as long as companies are added that are in their take-off phase or acceleration phase. At the end of a transition, however, there will be fewer companies in those phases.
Figure 4. The two most recent revolutions and the Dow. The stock value increase has accelerated enourmously during the acceleration phase of a revolution.
STOCK MARKET BOOMS
The Dow was first published in 1896. The Dow was calculated by dividing the sum of the 12 component company stocks by 12:
Dow-index_1896 = (x1 + x2+ ..........+x12) / 12
In 1916 the Dow was enlarged to 20 companies; 4 were removed and 12 added:
Dow-index_1916 = (x1 + x2+ ..........+x20) / 20
The shares of a number of companies were split in 1927, and for those shares a weighting factor was introduced in the calculation. The formula is now as follows (x1 = American Can is multiplied by 6, x2 = General Electric by 4 etc. )
Dow-index_1927 = (6.x1 + 4.x2+ ..........+x20) / 20
On 1 October 1928 the Dow was further enlarged to 30 stocks. Because everything had to be calculated by hand, the index calculation was simplified. The Dow Divisor was introduced. The index was calculated by dividing the sum of the share values by the Dow Divisor. In order to give the index an uninterrupted graph the Dow Divisor was given the value 16.67.
Dow-index_Oct_1928 = (x1 + x2+ ..........+x30) / Dow Divisor
Dow-index_Oct_1928 = (x1 + x2+ ..........+x30) / 16.67
Since then the Dow Divisor has acquired a new value every time there has been a change in the component stocks, with a consequent change in the formula used to calculate the index. This is because at the moment of change the results of two formulas based on two different share baskets must give the same result. When stocks are split the Dow Divisor is changed for the same reason.
In autumn 1928 and spring 1929 there were 8 stock splits, causing the Dow Divisor to drop to 10.47.
Dow-index_Sep_1929 = (x1 + x2+ ..........+x30) / 10.47
From that moment on a an increase (or decrease) of the set of shares results in almost three times as many (or fewer) index points as a year before. In the old formula the sum would have been divided by 30. The Dow’s highest point is on 3 September 1929 at 381 points.
So the extreme increase followed by an extreme decrease of the Dow in the period 1920 – 1932 was primarily caused by changes to the formula, the constant changes to the set of shares during the acceleration phase of the second industrial revolution and splitting of shares during this period. Because of these changes in the Dow investors were wrong footed. The companies whose shares constituted the Dow index at that time also continued into the stabilization and degeneration phase.
After the stock market crash of 1929, 18 companies were replaced in the Dow and the Dow Divisor got the value 15.1.
Table 1. Changes in the Dow, stock splits and the value of the Dow Divisor after the market crash of 1929
The table makes it clear that the Dow Jones formula has been changed many times and that the Dow Divisor in the period 1980-2000 (take off phase and acceleration phase of the third revolution ) and has actually become a Dow Multiplier, due to the large number of stock splits in that period. Where in the past the sum of the share values was divided by the number of shares, nowadays the sum of the share values multiplied by 7.5. Dividing by 0.132 is after all the same as multiplying by 7.5. (1 / 0,132 = 7,5). This partly explains the behaviour of the Dow graph since 1980.
SHARE PRICE / INCOME RATIO DURING AN INDUSTRIAL REVOLUTION
During the pre-development phase and the take-off phase of a revolution many new companies spring into existence. During the acceleration phase of a revolution it will be clear that many of these companies also enter the acceleration phase of their existence (Figure 5).
Figure 5. Typical course of market development: Introduction, Growth, Flourishing and Decline.
The expected value of the shares of these companies which are in the acceleration phase of their existence increases enormously. This is the reason why shares in the acceleration phase of a revolution become very expensive.
The share price / income ratio of shares increased enormously between 1920 – 1930 (the acceleration phase of the second revolution) and between 1990 – 2000 (the acceleration phase of the third revolution). In acceleration phase of a revolution there will always be a stock market boom (Figure 6).
Figure 6. Two industrial revolutions: share price / income ratio
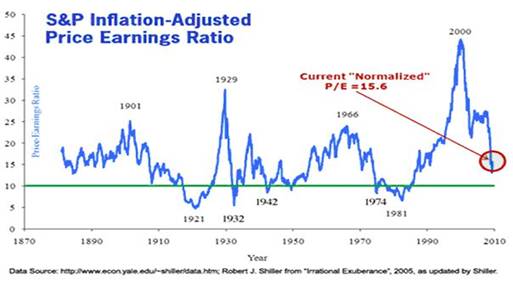
Share price / income ratio during a stabilization phase of a industrial revolution will decrease; The companies whose shares constituted the Dow also continued into the stabilization and degeneration phase (Figure 6).
WILL HISTORY REPEAT ITSELF?
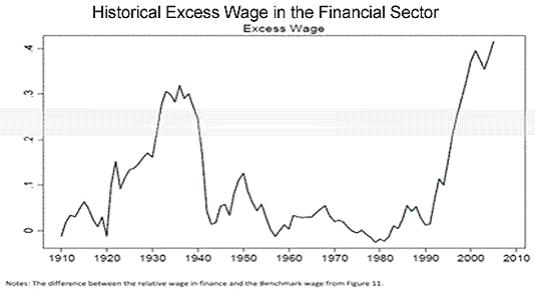
Calculating share indexes as described above and showing indexes in historical graphs is a useful way to show which phase the industrial revolution is in. Especially financial institutions play an important role during an industrial revolution. The graphs showing the wages paid in the financial sector therefore shows the same S curve as both revolutions.
Figure 7. Historical excess wage in the financial sector
The third industrial revolution is clearly in the saturation and degeneration phase. This phase can be recognized by the saturation of the market and the increasing competition. Only the strongest companies can withstand the competition or take over their competitors (like for example the take-overs by Oracle and Microsoft in the past few years). The information technology world has not seen any significant technical changes recently, despite what the American marketing machine wants us to believe.
Investors get euphoric when hearing about mergers and take overs. Actually, these mergers and take overs are indications of the converging processes at the end of a transition. When looked at objectively each merger or take over is a loss of economic activity. This becomes painfully clear when we have a look at the unemployment rates of some countries.
New industrial revolutions come about because of new ideas, inventions and discoveries, so new knowledge and insight. Here too we have reached a point of saturation. There will be fewer companies in the take-off or acceleration phase to replace the companies in the index shares sets that have reached the stabilization or degeneration phase.
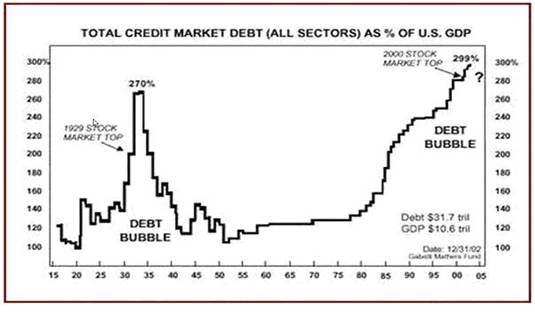
Humanity is being confronted with the same problems as those at the end of the second industrial revolution such as decreasing stock exchange rates, highly increasing unemployment, towering debts of companies and governments and bad financial positions of banks.
Figure 8. Two most recent revolutions: US market debt
Transitions are initiated by inventions and discoveries, new knowledge of mankind. New knowledge influences the other four components in a society. At the moment there are few new inventions or discoveries. So the chance of a new industrial revolution is not very high
History has shown that five pillars are indispensable for a stable society.
Figure 9. The five pillars for a stable society: Food, Security, Health, Prosperity, Knowledge.
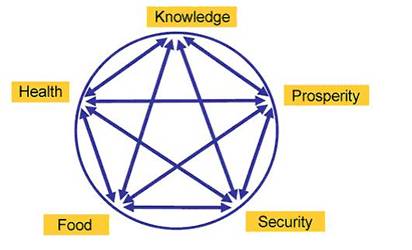
At the end of every transition the pillar Prosperity is threatened. We have seen this effect after every industrial revolution. The pillar Prosperity of a society is about to fall again. History has shown that the fall of the pillar Prosperity always results in a revolution. Because of the high level of unemployment after the second industrial revolution many societies initiated a new transition, the creation of a war economy. This type of economy flourished especially in the period 1940 – 1945.
Now, societies will have to make a choice for a new transition to be started.
Without knowledge of the past there is no future.
REFERENCES
Rotmans, J., Kemp, R., van Asselt, M.B.A., Geels, F., Verbong, G. en Molendijk, K. (2000), Transities & Transitiemanagement: de casus van een emissiearme energievoorziening
Grommen, W., (15 march 2011), “Huidige crisis, een wetmatigheid?”, Hermes, 49, (52 – 58)
Grommen, W., (januari 2010), “Beurskrach 1929, mysterie ontrafeld?”, Technische en Kwantitatieve Analyse, (22 – 24)
NOTE
This submission is the conclusion of a 15-year thought process of Wim Grommen. During a performance review on January 6, 1998 he was asked by the Executive Board of Transfer Solutions (Agnes Snellers and Gerard Hilte) to think about the future of Transfer Solutions and they introduced him to the S curve. The reflection on the S curve and the future of the company, gained momentum when the work, "Transitions and transition management, case study of a low-emission energy" of Prof. Dr. Ir. Jan Rotmans et al, appeared before him. In recent years, he has regularly discussed his insights with Dutch and Belgian scientists via articles about transitions (in relation to indices). Mirroring his insights with these scientists, their feedback and reading advice enabled him continually to refine his insight. He is therefore very grateful to Dutch and Belgian Science, especially:
Ad Broere |
Prof Herman van der Wee |
Marcel van der Linden |
Dr Auke Leen |
Jaap van Duijn |
Mark Eyskens |
Prof Dr Bart Nooteboom |
Prof Dr Jan Kok |
Prof. dr. Paul Klep |
Prof Dr Bas van Bavel |
Dr Jarl Kampen |
Prof Dr Peter van Bergeijk |
Prof Boudewijn de Bruin |
Prof Dr Johan Graafland |
Prof Dr Piet Duffhues |
Dr Casper de Vries |
Prof Dr Jules Theeuwes |
Prof Dr René Tissen |
Dr Dirk Bezemer |
Drs Krijn Poppe |
Prof Rick Van der Ploeg |
Frank van Dun |
Dr Lou Keune |
Prof Dr Theo van de Klundert |
Prof Dr Hans Visser |
Prof Louis Baeck |
Prof. Dr Tjeu Blommaert |
Prof Dr Harry van Dalen |
Prof. Dr. Mr. Marcel Pheijffer |
Prof Dr Ton van Schaik |
Wim Grommen
Transfer Solutions, Leerdam, The Netherlands. e-mail: wgrommen@transfer-solutions.com
International Symposium
The Economic Crisis: Time For A Paradigm Shift ~ . Towards a Systems Approach
January 24-25, 2013 - Universitat de València
© 2012 Copyright Wim Grommen- All Rights Reserved Disclaimer: The above is a matter of opinion provided for general information purposes only and is not intended as investment advice. Information and analysis above are derived from sources and utilising methods believed to be reliable, but we cannot accept responsibility for any losses you may incur as a result of this analysis. Individuals should consult with their personal financial advisors.
© 2005-2022 http://www.MarketOracle.co.uk - The Market Oracle is a FREE Daily Financial Markets Analysis & Forecasting online publication.