


Gold Price Forecast 2013, Buying Opportunity?, is Silver Cheaper?
Commodities / Gold and Silver 2013 Dec 24, 2012 - 02:18 AM GMTBy: Nadeem_Walayat

 Gold and Silver bugs have had an abysmally poor 2012 against expectations for new all time highs, where a 1 year bear market from the August 2011 high into the May 2012 low failed to spark a sustained run to new all time highs. The rally from which petered out by early October at $1800, followed by another trend back to leave Gold at $1657 as per the last close, this despite reams and reams of material plastered all over the internet that hoped for an eventual return to a gold standard or "Sound Money" as being the ultimate outcome of our ongoing global debt and money printing crisis.
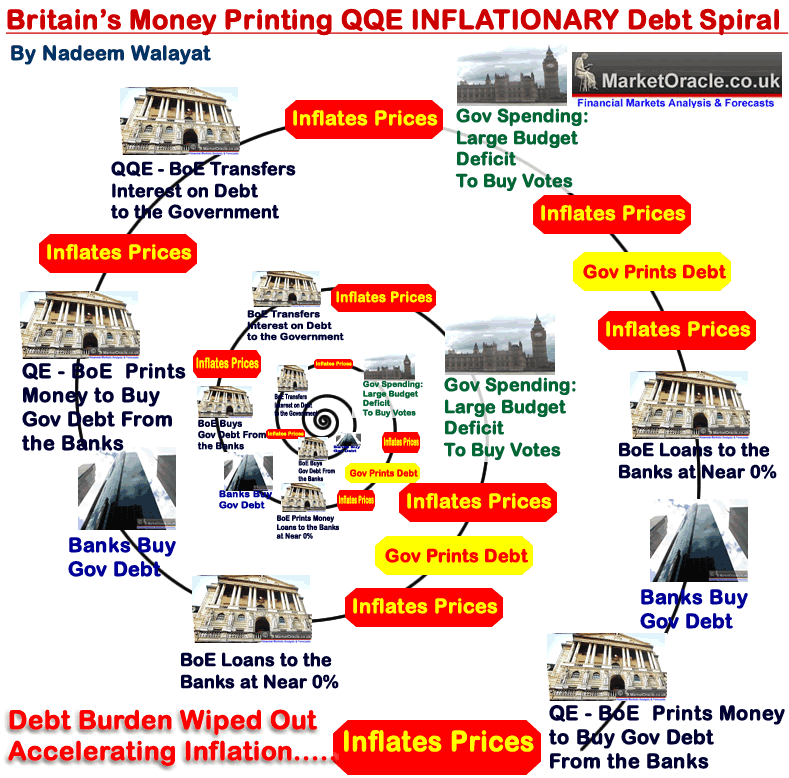
However, it is never going to happen, or rather not under any western style democracy, for this I don't need to indulge myself in in-depth analysis but direct readers attention to what continues to take place in the Euro-zone where the PIIGS countries having adopted pseudo sound money of the Euro have found themselves in the precise predicament of where they would be had they had a Gold standard, namely that they are unable to just print debt and money to buy votes with the stealth default consequences of inflation, whilst on the other hand we have the examples of the United States and UK that can and do print debt and money in ever expanding volume as they seek to buy up their own bonds (via central banks buying from bankrupt banks who borrow form the central banks to do so) and thus subvert the official debt to GDP ratios as I recently discussed in length (03 Dec 2012 - Bank of England Cancels Britain's Debt) with the below graph illustrating the money and debt printing / cancellation highly inflationary game that Britain is playing.
So, if you have read any of my articles over the past few years you will know that the only answer that the governments of the world have is to print money and debt to inflate the debt and liabilities away, Sound money or even pseudo sound money prevents them from doing so and therefore ensures a deflationary depression, instead we are emerged in an inflationary depression which given the real world comparisons appears to be infinitely far more palatable to the masses and therefore explains why it is every government and central banks default setting.
So Gold bugs looking for sound money to turn Gold into Currency will probably find that their descendants will still be waiting a for such an outcome. Ironically, if Gold never becomes money (in our life-times anyway) it is still good news for if it were then it would probably mean that Gold's future prospects would not be as good as they are under our fiat currency money / debt printing exponential inflation inducing monetary system as governments would seek to dictate what the price of gold should be rather than the current system of manipulation of all markets to varying degrees.
Now, whilst it has been been a long time since I last analysed or traded Gold and Silver. However, if you have been reading my articles you will be aware of the prevailing exponential inflation mega-trend as a consequence of government debt and money printing that continues to exert upwards pressure on asset prices and even more so when leverage is taken into account, therefore following the recent sell off in gold to $1660, a good 14% below its 2011 peak, which is perking my interest in the safe haven precious metals that this analysis seeks to resolve the probable trend for 2013.
Gold Forecast 2010-2012
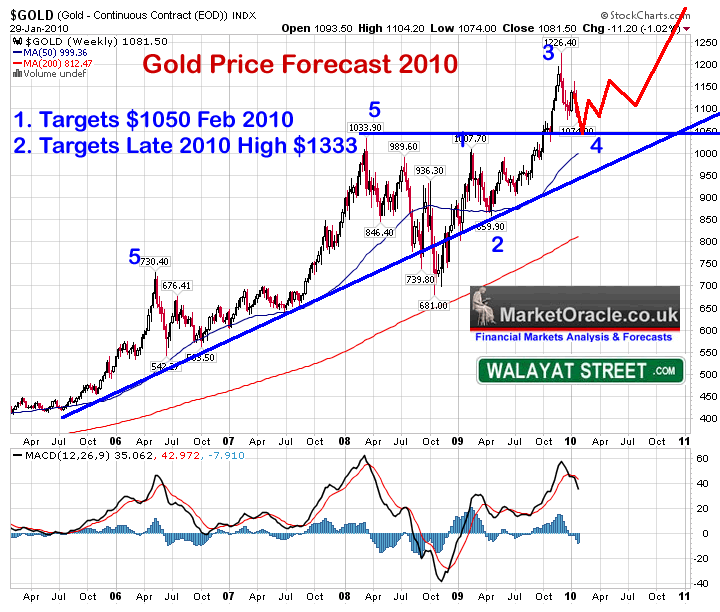
My last in depth analysis of Gold and Silver was several years ago at the start of November 2009 (01 Nov 2009 - Gold Bull Market Forecast 2009, 2010 Update)that was updated for the January 2010 Inflation Mega-trend ebook (Free Download).
At the time Gold was trading at $1035, and the forecast for Gold was for a rally to a minimum of $1333 by late 2010 and a longer-term target of $2,000 for 2011, which is pretty much what came to pass during the next few years.
Gold can expect to gyrate towards its target of $1333 by late 2010, and continue further on into 2011 as the Gold price continues to look set to trend towards $2,000 which should be easily achievable within the next 3 years.
Gold Secular Bull Market
From 1980 to 1999 Gold fell for 20 years, eventually it would bottom and embark on a bull market, eventually, the signs for this would be not in fundamental data, but contained within the price chart as Gold breaks the pattern of corrective rallies followed by the downtrend resuming to new bear market lows. Some 10 years later (into mid 2011) Gold corrected the preceding secular bear market by 50% in time and well over 100% in price. The subsequent trend has seen what resembles a multi-year consolidation of that preceding bull run.
Central Banks Buying Gold - For many years central banks were net sellers of gold but over the past year have been buying at the rate of about 10% of annual new supply. Though don't expect central bank buying to create a price spike as they would seek to avoid such an outcome by instead buying the dips.
Global Quantitative Easing aka Money Printing Hedging
We are in a new world (for the west anyway) and that is a world of Quantitative Easing, the more the governments of the world print money and monetize debt the easier it is for governments to keep printing and monetizing ever escalating amounts of government debt to cover the government budget deficit gaps. Upon which the accelerant of the Quantum of Quantitative Easing has been poured i.e. Governments paying themselves interest on monetized debt (20 Jul 2012 - The Quantum of Quantitative Easing Inflation is Coming! )
The US Fed recently revealed that its priority now is to target 6.5% Unemployment (7.7%) rather than inflation, in which respect it is engaged in a policy of QE4Ever -(01 Oct 2012 - Socialist Global Central Bank Crime Syndicate QE-4-Ever Inflation Theft)
What this means is collective currency devaluation where relatively there appears to be little change in currency rates but in real terms the flood of money consequences is for upward pressure on commodity prices and other scarce resources, after all the supply of resources is mostly known and the population of the world is not decreasing so the demand is known to be on an upward curve. Therefore as long as the central bankers are embarked on escalating quantitative easing that continues to put upwards pressure under the gold price and other commodities as it increases inflation expectations and therefore inflation hedging using gold and more liquid commodities such as crude oil.
Therefore in terms of Gold price action, we can expect the central banks to have effectively put a floor under the Gold price which the price charts implies is around $1550.
ZIRP - Zero interest rates are likely to continue until the markets force the central banks hands, which is something that there is no sign of at this point. ZIRP is a strong positive for Gold due to negative real interest rates and therefore indicates continuing upwards pressure on Gold price for as long as ZIRP continues.
Inflation Driving Gold Price?
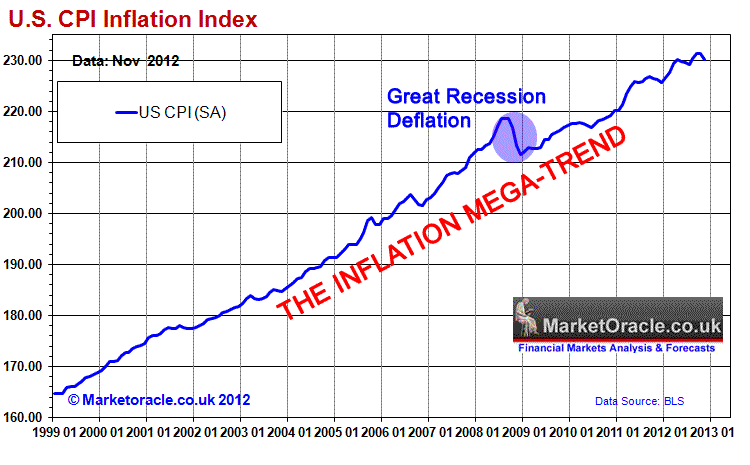
The above graph clearly illustrates that even on the official CPI inflation measure (which tends to under report real inflation), that the US is no different to any other country which contrary to the delusional deflation propaganda is instead immersed in what has always been an exponential inflation mega-trend which vested interests and what can be only termed as deflation fools have been blindly regurgitating the threats ever since the Great Recession of the 2008-2009, which the above graph clearly illustrates amounted to nothing more than a mere blip or as I warned at the time of a deflationary ripple on the surface of an ocean of Inflation.
The Inflation Mega-trend Ebook of Jan 2010 (FREE DOWNLOAD), re-iterated that asset prices tend to be LEVERAGED to Inflation, which is precisely the trends that have subsequently transpired from stocks to commodities such as Gold and as I have been flagging during 2012, the housing markets, in which respect I will be taking a detailed look at the US housing market in the near future, ensure you are subscribed to my always free newsletter to get this in-depth analysis and concluding trend forecast in your email in box.
However, even when taking into account Gold being leveraged to the Inflation Mega-trend, Gold rising by more than 300% over the past 10 years is well beyond the rise in CPI of 29%, so is much more a sign of a great deal of speculative interest than being driven by fundamentals. And another point for the Gold bug to consider is that in the late 1970's inflation was running at more than 10% per annum!
So whilst gold has not experienced a bubble spike, however it's relentless 10 year slog higher has accumulated much speculative interest that the subsequent 1.5 year corrective trend has been seeking to unwind, which still remains well above that which pure inflation indexation would have delivered over the same time period even after allowing for leverage, so one cannot look to the ongoing inflation mega-trend to generate additional over leveraged gains, instead the same trends imply that Gold needs to further dissipate speculative interest and therefore implies a continuation for a trading range.
U.S. Dollar Collapse?
One of the calls for why Gold will go higher is due to a sharp drop or even collapse of the US Dollar that many proponents have been stating for over the past 3 years. However the actual dollar trend shows that the dollar is in fact little changed. This is not as a consequence of dollar strength but that all currencies are in a state of perpetual free-fall against one another that manifests itself in asset and consumer price inflation.
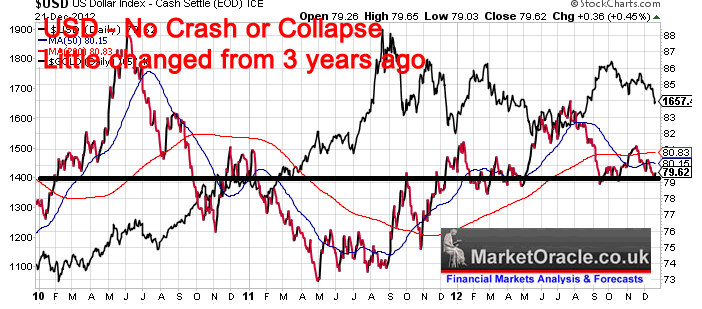
The chart also shows synchronicity between Gold and USD trends i.e. there are times when Gold and USD move with each other and at other times against. Current price action has both in synch in terms of trend, such cycles tend to persist for about 6 months, which implies the current phase has another 3 months to run. A quick take on the USD implies a continuing trading range.
Gold Annual Percent Change
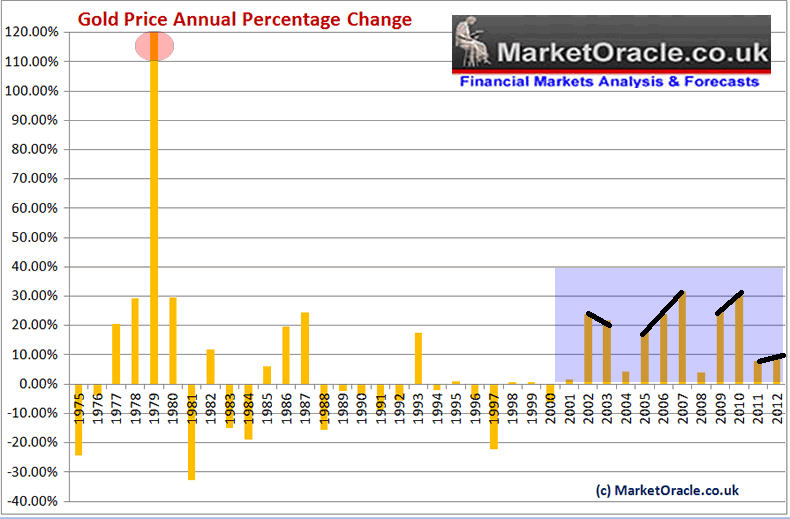
The annual % change graph further illustrates that whilst Gold has not experienced a short-term price spike along the lines of that of 1979, however one can see that it has experienced several spikes that were spread out over a number of years i.e. into 2003, 2007 and 2010. With the intra-2011 spike not registering as Gold experienced a sharp sell off into the end of that year.
What does this suggest for Gold going forward ?
That the best gains for the gold bull market are probably behind us, i.e. that Gold despite intra-year spikes is unlikely to experience annual gains of much more than about 10% per year with the probable range of between +4% and +10% per annum, which is the year end range one can expect for Gold for 2013, or a target price of between $1726 and $1826, which is not exactly what many gold bugs will be dreaming of i.e. a 1970's style spike for which I do not see any signs of materialising at least for several years, let alone for Gold to actually hold a break to new all time highs thus probability favours the bull market continuing at a far more subdued rate. So another warning not to get carried away by the uttering's from a long list of Gold bugs who keep banging the drums for a bubble spike that may never materialise (over the next 5 years).
ELLIOTT WAVE THEORY - The elliott wave pattern implies that Gold had an ABC corrective pattern into June 2012 since which it has had an impulse wave 1, and in the midst of coming to an end of a wave 2 correction, and therefore implying that Gold is set for an Impulse wave 3 to new all time highs! i.e. the elliot wave pattern is strongly bullish, which is contrary to most of this analysis. However rather than entertaining alternative counts that will only seem probable with the benefit of hindsight, in this analysis I am discounting elliott wave as not giving me a reliable probability, the picture is just too neat, for it to actually materialise.
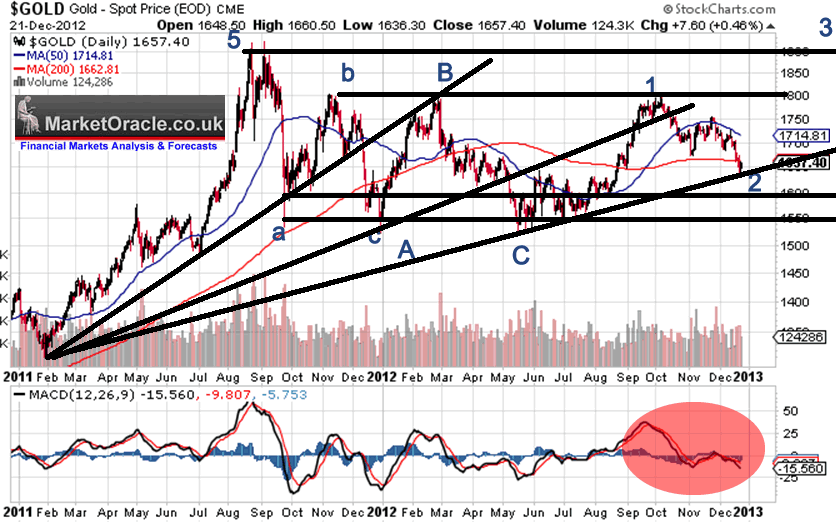
TREND ANALYSIS - Gold repeatedly failed to hold the uptrend lines which keeps resolving in breaks lower. That is the pattern that the current trend line support suggests as being most probable, i.e. an imminent bounce higher towards $1710 and then another break of the trendline support which would target a trend towards $1550. Furthermore shallow trendlines imply less volatile trends for 2013, i.e. shallow up and down trends within the prevailing range.
SUPPORT / RESISTANCE - Gold is in a range trading channel, the main resistance is at $1800 and support at $1550, with a break above $1800 targeting $1900. Whilst support at $1550 looks quite strong, thus suggests a strategy of buying downtrends towards $1550 for range rallies to $1800, with potentials for a break higher that would next target resistance at $1900. Current price action in terms of the range appears to resolve towards $1550 during Q1 2013, before we can expect the next assault on $1800.
However the problem with ranges is that it is difficult to determine at what point the price breaks out, and the ultimate probability is for Gold to break higher, to first $1900 and then $2000 and the longer the range goes on the harder it tends to become for the price to actually breakout and therefore more difficult to forecast. Which means given the 18 months to date, gold could stay stuck in this range for the whole of 2013.
PRICE TARGETS - The immediate target is a low above $1550, the reaction from which suggests $1800.
MACD - The MACD indicator is weak and showing no signs of an imminent bottom, in fact it is confirming that Gold could trend lower for at least another month into late January which would time with the probability for a continuing downtrend towards $1550 and a risk that Gold could remain weak even into late February.
SEASONAL TREND - There is a strong seasonal tendency for gold to rally from November through January, however Gold is clearly not following the seasonal trend which implies inverse expectations. Therefore a weak Jan, Feb and stronger March and April.
Gold - Silver Ratio - Which is Cheaper?
On face value the gold-silver ratio chart implies that Silver is cheap. BUT Silver is heavily dependant upon sentiment, i.e. it needs a strong trend for gain against Gold. Whilst in a shallow trend or a trading range will continue to see silver increasingly lag behind Gold, which means that whilst Silver is cheaper than Gold, given expectations for a continuation of the Trading range, silver could yet get even cheaper relative to Gold i.e. as was the case during the first half of 2010.
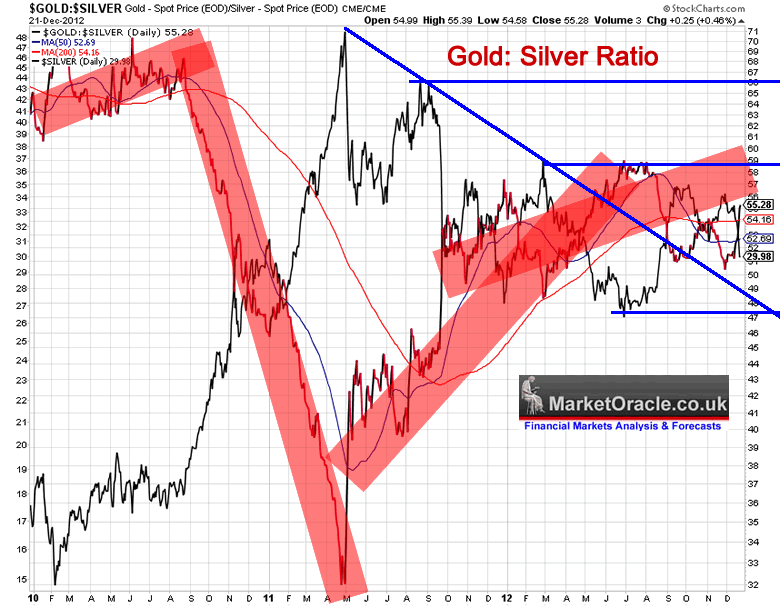
However should Gold breakout higher above $1800 we will see Silver start to significantly outperform, so I will definitely be keeping an eye on silver especially near Gold lows of $1550 as it would be trading at deeper discount.
Gold Risks of a Down Year
Gold has not had a down year for 12 years! Add to that expectations of a trading range of 1800 to 1550. Throw in a close of $1660, and annual volatility of 20% and then that implies a 40% risk of a down year, i.e. a close below $1660, which could yet worsen if Gold rallies into the end of the year i.e. Gold closing the year at say $1710 would imply a 60% chance of a down year, whilst a close at $1600 would imply just a 20% risk of a down year.
Gold Price Forecast Conclusion
The bottom line is that whilst the Gold bull market will likely continue until ZIRP ends, however Gold bugs are not going to like hearing that the best years of gains are now probably behind gold, and that the best they can expect to achieve is gains of about 10% per annum as Gold is now in a mature bull market. Therefore my analysis resolves to the following key conclusions for 2013 -
1. That Gold looks set to trade within a range for most of the year of between $1550 and $1800.
2. That Gold should trend higher towards the end of the year with overall probability targeting a year end close in the region of $1760, which on the last close of $1660 implies a gain of about 6%, with a 40% risk of a small down close year i.e. between $1659 and $1550.
The below graph better illustrates how the Gold price could trend during the year.
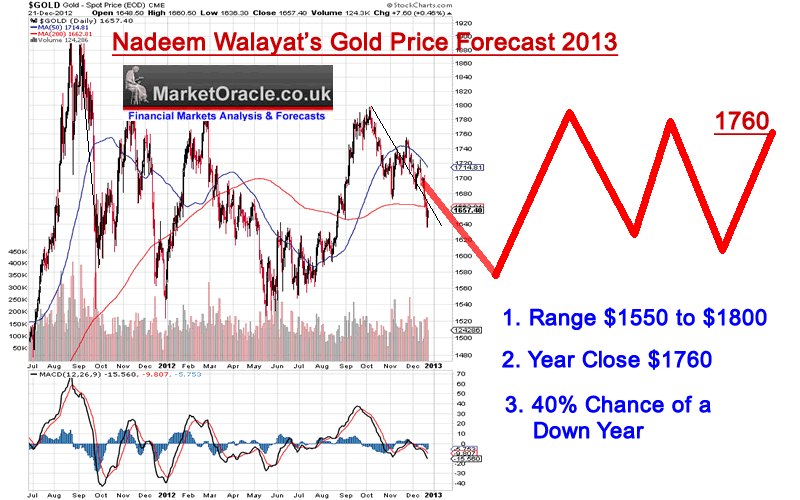
The risks to the forecast are that the Gold price breaks higher to first target $1900.
 My Gold Investing / Trading Strategy
I will be adopting two potential strategies.
1. I will eye accumulating Gold when it is sub $1580 for long-term investments, probably upto 6% of total portfolio (Gold and Silver). Silver offers the better long-term opportunity in terms of risk vs reward off of the lows due to expectations for a deeper discount and greater long-term potential.
2. I will attempt to trade the range when opportunities arise i.e. buy off of $1550 triggers and exit from $1800 triggers. With the risk of an ultimate breakout higher I will refrain from trading the short-side. Also remember trading commodities is extreme high risk!
Ensure you remain subscribed to my always free newsletter to get my next in-depth analysis and concluding trend forecast.
Source and Comments: http://www.marketoracle.co.uk/Article38201.html
Happy Holidays
&
a Prosperous New Year
By Nadeem Walayat
Copyright © 2005-2012 Marketoracle.co.uk (Market Oracle Ltd). All rights reserved.
Nadeem Walayat has over 25 years experience of trading derivatives, portfolio management and analysing the financial markets, including one of few who both anticipated and Beat the 1987 Crash. Nadeem's forward looking analysis focuses on UK inflation, economy, interest rates and housing market. He is the author of three ebook's - The Inflation Mega-Trend; The Interest Rate Mega-Trend and The Stocks Stealth Bull Market Update 2011 that can be downloaded for Free.
Nadeem is the Editor of The Market Oracle, a FREE Daily Financial Markets Analysis & Forecasting online publication that presents in-depth analysis from over 600 experienced analysts on a range of views of the probable direction of the financial markets, thus enabling our readers to arrive at an informed opinion on future market direction. http://www.marketoracle.co.uk
Disclaimer: The above is a matter of opinion provided for general information purposes only and is not intended as investment advice. Information and analysis above are derived from sources and utilising methods believed to be reliable, but we cannot accept responsibility for any trading losses you may incur as a result of this analysis. Individuals should consult with their personal financial advisors before engaging in any trading activities.
Nadeem Walayat Archive |
© 2005-2022 http://www.MarketOracle.co.uk - The Market Oracle is a FREE Daily Financial Markets Analysis & Forecasting online publication.
Comments
|
R.E.B
24 Dec 12, 10:48 |
Gold is Long Term Hold
Surely the correct way to view gold is a long term hold? Iam not thinking about next years gold price, Iam thinking about gold in 5 or 8 years time. At some point this money printing is going to run its course, even Zimbabwe had to stop printing money eventually,and the central banks will reach a fork in the road just like they did at the end of the 70's. I think we are heading for a very messy scenario at some point, even if it does take a few years, and I want a little bit of gold just in case! Thanks for the articles! |
|
Nadeem_Walayat
24 Dec 12, 16:41 |
Gold Insurance
Hi REB I think the best way to view gold is not as an investment but as insurance i.e. against SHTF and inflation (if its cheap). Silver best as a trade, at best a multi-year trade. Best NW |
|
jannenet
26 Dec 12, 06:30 |
Supply demand and leverage
Hi, Great article as always Nadeem. Have you taken into account the following three aspects in your forecast? - Supply/demand - Leverage in paper market - Global share of portfolio SUPPLY/DEMAND As Eric Sprott claims often, demand has increased (central banks now buying) while supply has been rather static? When looking into supply/demand of gold it is rather hard to see how prices has not(or will not) corrected upwards. LEVERAGE IN PAPER MARKET Further of interest is the fact that the paper gold allows for high leverage relative to available actual and physical gold making the games of musical chairs seem probable in a not too distant future should we have a "gold run". What would happen to gold price if everyone lost trust in their paper-counter-part and demanded physical delivery? GLOBAL SHARE OF PORTFOLIO Even with your relatively low estimated annual yield of gold, you aim at about 6% of assets in gold/silver. Currently, the global investment portfolio has about 2% in gold. This could be a dramatic igniter for gold price should more join your portfolio allocation practice due to increased fear of inflation. Br Jan |
|
Nadeem_Walayat
26 Dec 12, 14:31 |
Gold Mature Bull Market
Hi The price rally of 300% over 10 years is already discounting much of the above. i.e. 300% against inflation of 30% As is the case with most bull markets, the expectations AFTER a long run in prices seems to rachet up exponentially i.e. I see many calls of Gold $5k to $15k over the next few years. In my experience this is what tends to happen towards the END of bull markets. Not that I am forecasting an end because there is no sign of an end at this point in time. Best NW |
|
kudikyala
26 Dec 12, 16:26 |
similar article on stock market for 2013
Hi Nadeem, Can you post similar article on trend forecast for stock market for 2013? Really appreciate your articles. Thanks, shyam |
|
Nadeem_Walayat
26 Dec 12, 18:10 |
Market Forecasts
Hi Ive put my original plans for analysis of inflation on hold and instead will focus on market forecasts. My next piece will be on stocks or US housing before year end. However server maintenance issues may interfere so I will also post a version to youtube http://www.youtube.com/user/MarketOracleTV Best NW |
|
Jane S
15 Feb 13, 18:29 |
Spooky
Nadeem Your forecasts are spookily accurate! If ever you start to charge for a paid service, I for one will be more than willing to pay. Kindest regards Jane S. |
|
Nadeem_Walayat
16 Feb 13, 00:16 |
Driver for Accurate Analysis
Hi Jane A fundemental driver for arriving at high probability conclusions is that if I am wrong I will lose money, if I am right I will make money, take that away then the analysis will suffer, as my focus is on what is actually the most probable, rather than what paid subscribers might want to hear. And as I want to avoid losing money, I go in every direction to see what have missed. Analysis is like peeling an onion, towards which the tools do not matter just the conclusion. Whereas as a newsletter peddler I would have to inflate the tools i.e. that I have some magic black box of tricks, when in reality it's just plain simple hard work. The extreme example are the clueless academic economists who get rewarded by fellow academics for being wrong! And the general public see all awards and think they know what they are talking about when the reality is that a coin toss would be infinetly more accurate! Best NW |