


Government Spending is Not Economic Growth: Real GDPP 2000–2011
Economics / Economic Theory Dec 23, 2012 - 11:06 AM GMTBy: Robert_Higgs

 In the 1930s and 1940s, when the modern system of national income and product accounts (NIPA) was being developed, the scope of national product was a hotly debated issue. No issue stirred more debate than the question, Should government product be included in gross product? Simon Kuznets (Nobel laureate in economic sciences, 1971), the most important American contributor to the development of the accounts, had major reservations about including all government purchases in national product. Over the years, others have elaborated on these reasons and adduced others.
Why should government product be excluded? First, the government’s activities may be viewed as giving rise to intermediate, rather than final products, even if the government provides such valuable services as enforcement of private property rights and settlement of disputes. Second, because most government services are not sold in markets, they have no market-determined prices to be used in calculating their total value to those who benefit from them. Third, because many government services arise from political, rather than economic motives and institutions, some of them may have little or no value. Indeed, some commentators—including the present writer—ultimately went so far as to assert that some government services have negative value: given a choice, the people victimized by these “services” would be willing to pay to be rid of them.
When the government attained massive proportions during World War II, this debate was set aside for the duration of the war, and the accounts were put into a form that best accommodated the government’s attempt to plan and control the economy for the primary purpose of winning the war. This situation of course dictated that the government’s spending, which grew to constitute almost half of the official GDP during the peak years of the war, be included in GDP, and the War Production Board, the Commerce Department, and other government agencies involved in calculating the NIPA recruited a large corps of clerks, accountants, economists, and others to carry out the work.
After the war, the Commerce Department, which carried forward the national accounting to which it had contributed during the war (since 1972 within its Bureau of Economic Analysis [BEA]), naturally preferred to continue the use of its favored system, which treats all government spending for final goods and services as part of GDP. Economists such as Kuznets, who did not favor this treatment, attempted for a while to continue their work along their own, different lines, but none of them could compete with the enormous, well-funded statistical organization the government possessed, and eventually almost all of them gave up and accepted the official NIPA.[1]
Thus did government spending become lodged in the definition and measurement of GDP in a way that ensuing generations of economists, journalists, policy makers, and others considered appropriate and took for granted. Nonetheless, the issues that had been disputed at length in the 1930s and 1940s did not disappear. They were simply disregarded as if they had been resolved, even though they had not been resolved intellectually, but simply swept under the Commerce Department’s expansive (and expensive) rug. In particular, the inclusion of government spending in GDP remained extremely problematic.
Generations of elementary economics students since World War II have come away from Economics 101 having learned, if anything, that gross domestic product is defined as
GDP = C + I + G + (X - M).
That is, GDP for a given period, usually a year, is the sum of spending for final goods and services by domestic private consumers, domestic private investors, and governments at all levels, plus foreign purchases of U.S. exports minus American purchases of U.S. imports.
This sort of accounting supplies the basic framework for the Keynesian models that swept the economics profession in the 1940s and 1950s, from which a key policy conclusion was derived—that the government can vary its spending to offset shortfalls or excesses of private spending and thereby stabilize the economy’s growth while maintaining “full employment.” From the beginning, the most emphasized part of this conclusion was that increases in government spending can offset declines in private spending and thereby prevent or moderate macroeconomic contractions.
Much of the increase in government spending in recent decades has taken the form of increased transfer payments—payments for which the government receives no current good or service in return—such as Social Security pensions, disability benefits, and payments via Medicare or Medicaid to subsidize program beneficiaries’ health-care services. In 2000, such payments amounted to 56 percent of all federal spending; in 2011, they were more than 61 percent. Transfer payments do not enter the computation of national income and product; only purchases of final goods and services do so. Keynesian economists argue, however, that government may use increases in transfer payments to cushion business slumps in the same way that it may use increases in its purchases of final goods and services because increases in transfer payments augment personal income and stimulate greater consumption spending, hence greater investment spending, and therefore, from both sources, an increase in GDP.
The foregoing issues have taken on special cogency during the past five years, as the federal government has greatly increased its total spending. Real total federal outlays increased by 32 percent, from $2,729 billion to $3,603 billion (in chained 2005 dollars), between fiscal years 2007 and 2011. Although much of this increase has taken the form of increases in transfer payments, the part that is included in GDP has also risen substantially—at the federal level, it increased by 15.6 percent (in real dollars) between 2007 and 2011. Some of this increase was offset by a decrease in state and local government purchases of final goods and services, which fell by 3 percent during this period. (Data come from BEA, Table 1.1.6, Real Gross Domestic Product, Chained Dollars.)
As the basic Keynesian model implies, the recent increases in government spending appear to have prevented an even greater decline in real GDP during the recession that began in the winter of 2007-2008. But however that may be, because so much of this spending may have had little or no value—or even negative value—in itself, the question remains as to whether, despite what the official GDP figures show, the population’s true economic well-being might have suffered a greater contraction than mainstream economists, journalists, policy makers, and others for the most part believe.
To resolve this question, I have computed what I call gross domestic private product (GDPP), which is simply the standard real GDP minus the government purchases part of it. (Data come from BEA, Table 1.1.6, Real Gross Domestic Product, Chained Dollars.) The figure shows the movement of this variable from 2000 to 2011, the most recently completed year.
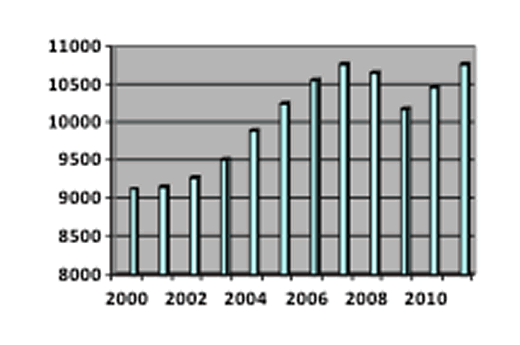
If real GDPP had grown at its long-run average rate of about 3 percent per year during the period from 2000 to 2011, it would have increased by about 38 percent. In reality, however, GDPP increased during this period by only 18 percent, or by about 1.5 percent per year on average. (Real GDP, by comparison, increased by about 1.6 percent per year on average, producing a small increase in the government share of GDP.) So, during this period of more than a decade, private product grew at only about half of its historical average rate. Between 2002 and 2007, while the housing bubble was giving rise to seemingly buoyant growth even beyond the housing sector, the good times appeared to have returned, but the inevitable bust from 2007 to 2009 and the slow recovery since 2009 pulled the intermediate-run growth rate for 2000-2011 back to an anemic level. The recovery of the period 2009-2011 brought the GDPP back only to its 2007 level, signifying four years in which no net gain had been made and much suffering had occurred between the beginning and the end of the period.
Perhaps the most positive statement we can make about the private economy’s performance during this twelve-year period is that it has been somewhat better than complete stagnation. But private product has lost ground relative to total official GDP. Moreover, many of the measures taken to deal with the contraction—the government’s huge run-up in its spending and debt; the Fed’s great expansion of bank reserves, its allocation of credit directly to failing companies and struggling sectors, and its accommodation of the federal government’s gigantic deficits; and the government’s enactment of extremely unsettling regulatory statutes, especially Obamacare and the Dodd-Frank Act—have served to discourage the private investment needed to hasten the recovery and lay the foundation for more rapid economic growth in the long run. To find a similar perfect storm of counter-productive government fiscal, monetary, and regulatory policies, we must go back to the 1930s, when the measures taken under Herbert Hoover and Franklin D. Roosevelt turned what probably would have been an ordinary, short-lived recession into the Great Depression.[2] If the government and the Fed persist in the kind of destructive policies they have undertaken since 2007, the potential for another great depression will remain. Even without such a catastrophe, the U.S. economy presents at best the prospect of weak performance for many years to come.
Notes
[1] Robert Higgs, Depression, War, and Cold War: Studies in Political Economy (New York: Oxford University Press, 2006), pp. 64-68; and Ellen O’Brien, “How the ‘G’ Got into the GNP,” in Perspectives on the History of Economic Thought, vol. 10, Method, Competition, Conflict and Measurement in the Twentieth Century, ed. Karen I. Vaughn. (Aldershot, England: Edward Elgar, 1994), p. 242.
[2] Robert Higgs, Crisis and Leviathan: Critical Episodes in the Growth of American Government (New York: Oxford University Press, 1987), pp. 159-95; Higgs, Depression, War, and Cold War, pp. 3-29.
Robert Higgs is senior fellow in political economy for the Independent Institute and editor of The Independent Review. He is the 2007 recipient of the Gary G. Schlarbaum Prize for Lifetime Achievement in the Cause of Liberty. Send him mail. See Robert Higgs's article archives.
© 2012 Copyright Ludwig von Mises - All Rights Reserved Disclaimer: The above is a matter of opinion provided for general information purposes only and is not intended as investment advice. Information and analysis above are derived from sources and utilising methods believed to be reliable, but we cannot accept responsibility for any losses you may incur as a result of this analysis. Individuals should consult with their personal financial advisors.
© 2005-2022 http://www.MarketOracle.co.uk - The Market Oracle is a FREE Daily Financial Markets Analysis & Forecasting online publication.