


U.S. Miles Driven Economic Indicator Hits Another Post-Crisis Low
Economics / US Economy Dec 23, 2012 - 10:36 AM GMTBy: PhilStockWorld

 Courtesy of Doug Short.The Department of Transportation’s Federal Highway Commission has released the latest report on Traffic Volume Trends, data through October. Travel on all roads and streets changed by 0.3% (0.9 billion vehicle miles) for October 2012 as compared with October 2011. The 12-month moving average of miles driven increased only 0.51% from October a year ago (PDF report). And the civilian population-adjusted data (age 16-and-over) has set another post-financial crisis low.
Here is a chart that illustrates this data series from its inception in 1970. I’m plotting the “Moving 12-Month Total on ALL Roads,” as the DOT terms it. See Figure 1 in the PDF report, which charts the data from 1987. My start date is 1971 because I’m incorporating all the available data from the DOT spreadsheets.
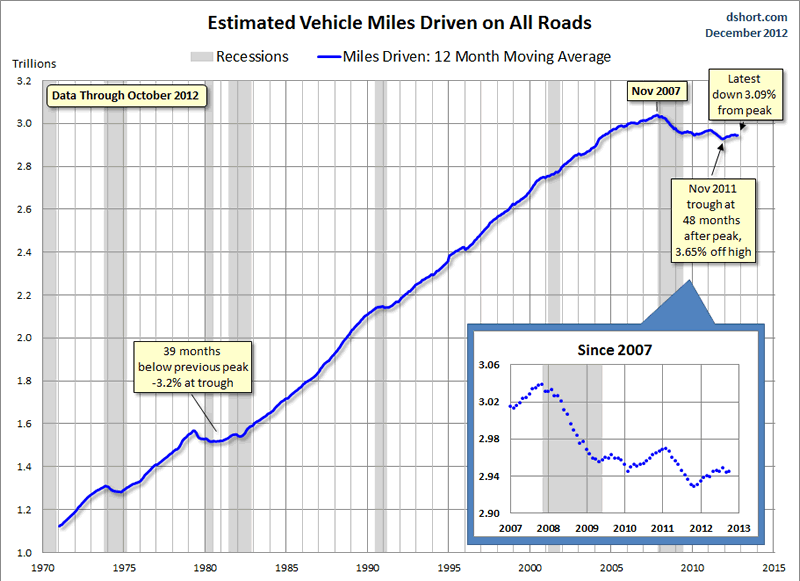
The rolling 12-month miles driven contracted from its all-time high for 39 months during the stagflation of the late 1970s to early 1980s, a double-dip recession era. The most recent dip has lasted for 55 months and counting — a new record, but the trough to date was in November 2011, 48 months from the all-time high.
The Population-Adjusted Reality
Total Miles Driven, however, is one of those metrics that should be adjusted for population growth to provide the most revealing analysis, especially if we’re trying to understand the historical context. We can do a quick adjustment of the data using an appropriate population group as the deflator. I use the Bureau of Labor Statistics’ Civilian Noninstitutional Population Age 16 and Over (FRED series CNP16OV). The next chart incorporates that adjustment with the growth shown on the vertical axis as the percent change from 1971.
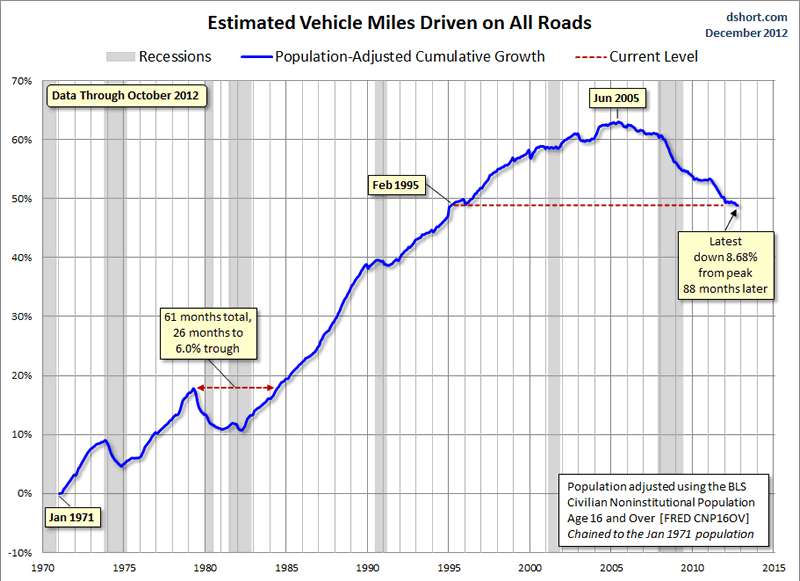
Clearly, when we adjust for population growth, the Miles-Driven metric takes on a much darker look. The nominal 39-month dip that began in May 1979 grows to 61 months, slightly more than five years. The trough was a 6% decline from the previous peak.
The population-adjusted all-time high dates from June 2005. That’s 88 months — over seven years ago. The latest data, for October 2012, is 8.68% below the 2005 peak, a new post-Financial Crisis low. Our adjusted miles driven based on the 16-and-older age cohort is about where we were as a nation in February 1995.
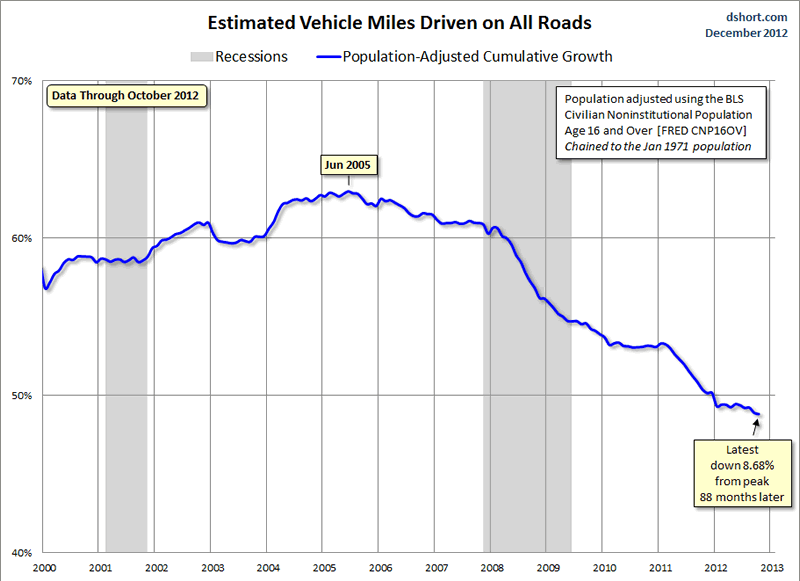
Here is a closer look at the series since 2000, which gives a better look at the 2012 flatline — similar to the equivalent months in 2010.
About that Population Adjustment…
I’ve frequently been asked why I use the CNP16OV data for the population adjustment, often with the suggestion that it would make more sense to limit the population to licensed drivers. For openers, I don’t know of a valid source for the driver-licensed population. Moreover, the correlation between license holders and actual drivers is not a reliable one. Many license holders in households do not drive, especially in their older years. According to Census Bureau data on gasoline sales (courtesy of Harry Dent’s research on demand curves), dollars spent on gasoline peaks for people in their late 40s and falls off rather quickly after that.
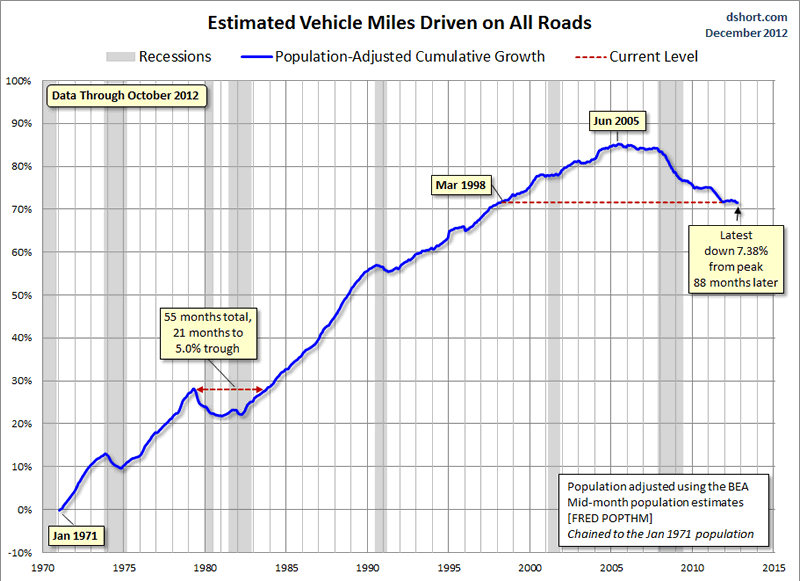
In fact, I think there’s a good case for using the Census Bureau’s mid-month estimates of total population (POPTHM) rather than civilians age 16 and over for the population adjustment. The reason is that a portion of total miles driven is specifically to support children’s needs (day care, schools, children’s activities, etc.) and the needs of elders who might have licenses but no longer drive. Ultimately the division of miles driven by either population group (CNP16OV or POPTHM), while not a perfect match with drivers, is a consistent and relevant metric for evaluating economic growth.
Here is the same population-adjusted chart, this time with the total population for the adjustment. In the total-population adjusted version the post-recession low is the latest data point of -7.38%.
What about the impact of volatile gasoline prices? How much of a factor has that been in the trend? I’ll close with an overlay of the population-adjusted miles driven and gasoline prices since the early 1990s.
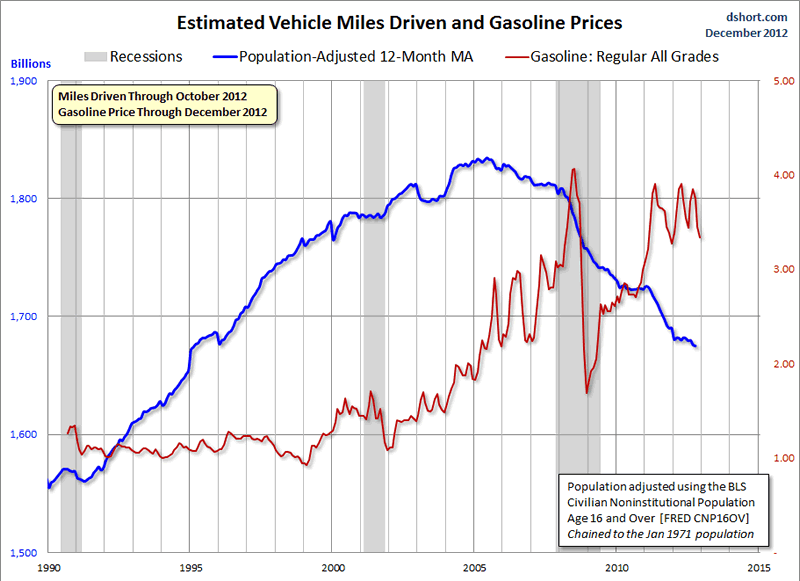
As is readily apparent, the correlation is fairly weak over the entire timeframe (+0.32). And, despite the volatility in gasoline prices since the onset of the Great Recession, the correlation since December 2007 has been even weaker (-0.26). There are profound behavioral issues apart from gasoline prices that are influencing miles driven. These would include the demographics of an aging population in which older people drive less, continuing high unemployment, and the ever-growing ability to work remote in the era of the Internet.
One particularly interesting trend was highlighted in a recent study on “Transportation and the New Generation” by the Frontier Group.
| From 2001 to 2009, the average annual number of vehicle miles traveled by young people (16 to 34-year-olds) decreased from 10,300 miles to 7,900 miles per capita?a drop of 23 percent. [PDF source] |
The DOT “miles driven” metric is also interesting to study in the context of gasoline volume sales, which I also update monthly:
- Phil
Philip R. Davis is a founder of Phil's Stock World (www.philstockworld.com), a stock and options trading site that teaches the art of options trading to newcomers and devises advanced strategies for expert traders. Mr. Davis is a serial entrepreneur, having founded software company Accu-Title, a real estate title insurance software solution, and is also the President of the Delphi Consulting Corp., an M&A consulting firm that helps large and small companies obtain funding and close deals. He was also the founder of Accu-Search, a property data corporation that was sold to DataTrace in 2004 and Personality Plus, a precursor to eHarmony.com. Phil was a former editor of a UMass/Amherst humor magazine and it shows in his writing -- which is filled with colorful commentary along with very specific ideas on stock option purchases (Phil rarely holds actual stocks). Visit: Phil's Stock World (www.philstockworld.com)
© 2012 Copyright PhilStockWorld - All Rights Reserved Disclaimer: The above is a matter of opinion provided for general information purposes only and is not intended as investment advice. Information and analysis above are derived from sources and utilising methods believed to be reliable, but we cannot accept responsibility for any losses you may incur as a result of this analysis. Individuals should consult with their personal financial advisors.
PhilStockWorld Archive |
© 2005-2022 http://www.MarketOracle.co.uk - The Market Oracle is a FREE Daily Financial Markets Analysis & Forecasting online publication.