


Technical Tools to Help Identify High Confidence Market Price Reversal Zones
/ Learn to Trade Dec 20, 2012 - 05:04 AM GMTBy: EWI


"Price gaps, wave relationships and Fibonacci retracements act as support or resistance for countertrend price moves. When combined, these characteristics help identify high-probability reversal zones."
-Jeffrey Kennedy
Technical analysis offers several ways to spot pullbacks that indicate a reversal of the larger trend. When you use the Elliott Wave Principle, it can be very useful to "gain a consensus" from more than one indicator to spot a high-confidence trading opportunity.
The following lesson is adapted from Jeffrey Kennedy's December 11 Elliott Wave Junctures educational subscription service:
Identifying high-probability reversal zones is simple, IF you know what to look for.
- Price gaps occur when the range of a price bar does not include the range of the previous bar. It acts as a reliable level of support and resistance for subsequent price action and should always be monitored.
- Elliott wave relationships help identify a range that will lead to the resumption of the larger trend. The most common relationship between waves C and A of zigzags and flats is equality, the second being a 1.382 multiple.
- Fibonacci retracements: Fourth waves tend to encounter Fibonacci support/resistance at a .382 multiple of wave three. Depending on the depth and duration of the correction, prices may also test the .500 and .618 retracements.
In the daily chart for Akami Tech Inc. (AKAM), you can identify all 3 characteristics:
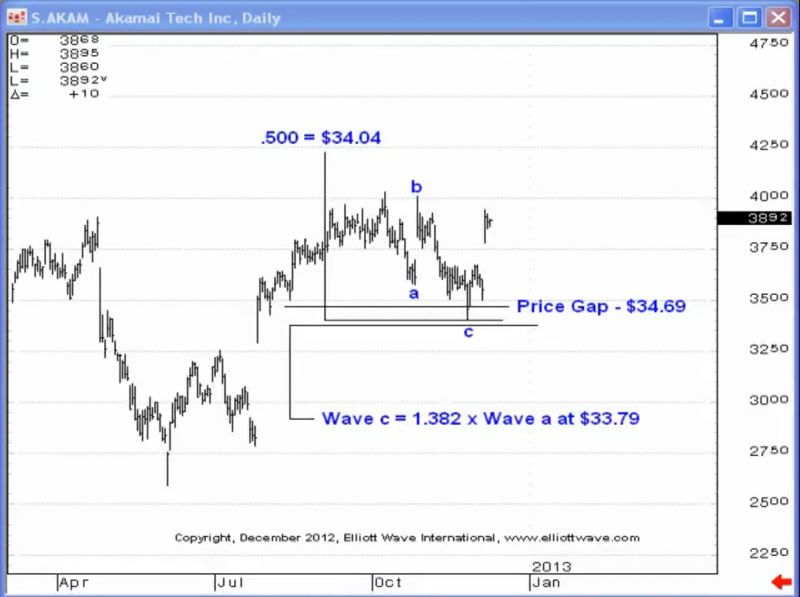
- Price gap at 34.69
- Elliott wave relationship of 1.382 between waves C and A of a zigzag pattern at $33.79
- Fibonacci retracement at 50% of the prior advance at $34.04.
Using this information, you can see the very tight zone in which you may locate a probable reversal in this market (within the red circle).
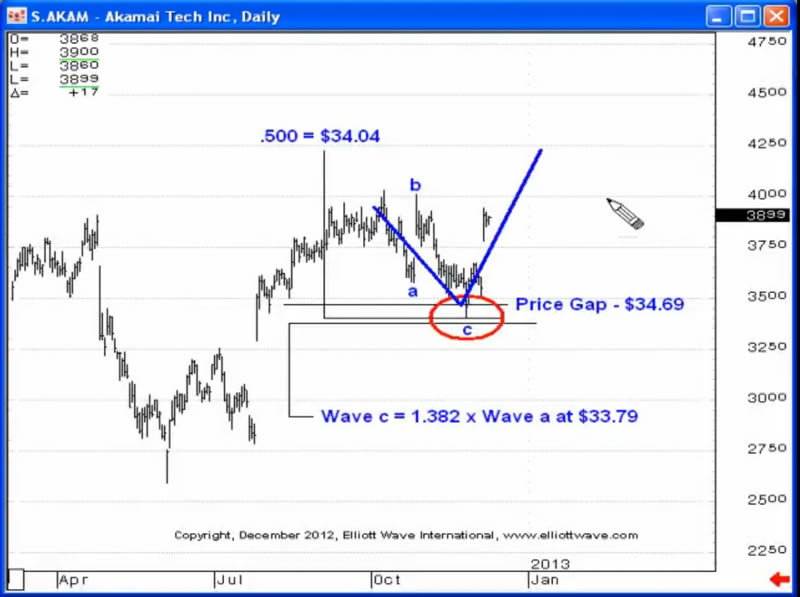
Rather than focus on a single indicator, Jeffrey encourages you to combine them together to better identify high-confidence reversal zones in your price charts.
|
Learn About Moving Averages, One of Jeffrey Kennedy's Favorite Indicators, in this Free 10-page eBook from Elliott Wave International Moving averages are one of the most widely-used methods of technical analysis because they are simple to use, and they work. Now you can learn how to apply them to your trading and investing in this free 10-page eBook. Learn step-by-step how moving averages can help you find high-confidence trading opportunities. Improve your trading and investing with Moving Averages! Download Your Free eBook Now >> |
This article was syndicated by Elliott Wave International and was originally published under the headline Chart Example - How to Identify High Confidence Reversal Zones. EWI is the world's largest market forecasting firm. Its staff of full-time analysts led by Chartered Market Technician Robert Prechter provides 24-hour-a-day market analysis to institutional and private investors around the world.
About the Publisher, Elliott Wave International
Founded in 1979 by Robert R. Prechter Jr., Elliott Wave International (EWI) is the world's largest market forecasting firm. Its staff of full-time analysts provides 24-hour-a-day market analysis to institutional and private investors around the world.
© 2005-2022 http://www.MarketOracle.co.uk - The Market Oracle is a FREE Daily Financial Markets Analysis & Forecasting online publication.