


Trading The ABC Sentiment Shifts Ahead Of The Crowd
InvestorEducation / Learn to Trade Dec 19, 2012 - 02:27 AM GMTBy: David_Banister

 One of the most obvious keys to successful trading or investing is buying low and selling high. The problem being if it was that easy to pinpoint those low and high points then all traders would be batting 1000%. What we use at my ATP service is a combination of fundamental analysis and catalyst spotting inter-twined with charting techniques. Most of our work revolves around buying substantial dips in a strong stock, 3x ETF’s, or reversal patterns. 3x ETF’s are great for short term swings as they function almost exclusively on crowd behavioral patterns, but it also applies to individual stocks.
In all cases what traders really need to spot ahead of the masses of investors is a subtle shift in sentiment. That key pivot point where the negative sentiment whether it be short term or long term is about to run out of gas, and the bullish sentiment is going to take over and reverse the stock or ETF higher or break the position out of a base pattern.
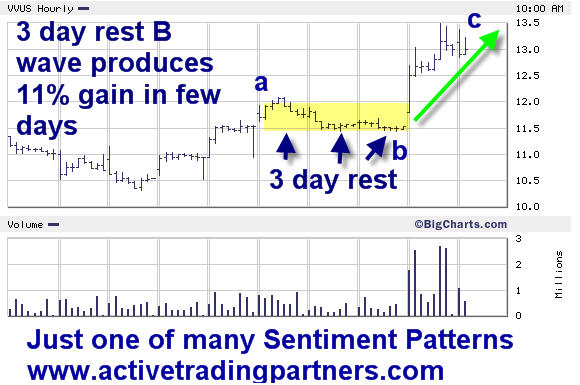
One of the most common patterns amongst many that we use as trigger points is the ABC pattern. This is a situation where the stock or ETF recently had a strong run. That run produced a flurry of over-optimistic sentiment and is reflected in the high spike in the stock from the prior base. We call this the “A Wave High” pivot point. This is where many of the traders who chase short term performance come in with a bang, right near the top.
The next key component is obviously then the “B Wave” pattern. There are many different formations for B Wave patterns, the one we will look at today is the “3 day rest” pattern.
B waves simply serve to work off the overbought sentiment of the crowd and remove the chasers who came into the trade high, at a loss. As the stock pulls back hard initially in the B Wave, stop losses are triggered by those with discipline. However, many traders continue to buy more of the position a bit early during this crucial B Wave pattern and then later they also get stopped out. Finally, Margin Calls are common and more stops are triggered and the B wave winds down and sentiment is horrible.
At that strategic bottoming area of the B Wave correction is where you want to start scaling long into the position for the ensuing reversal to the upside. Sometimes these are very short term trades as in 48 hours or so, and sometimes they are several weeks long depending. Many of the B waves on daily charts are what we term a “3 Day Rest” pattern, spotting these is very profitable.
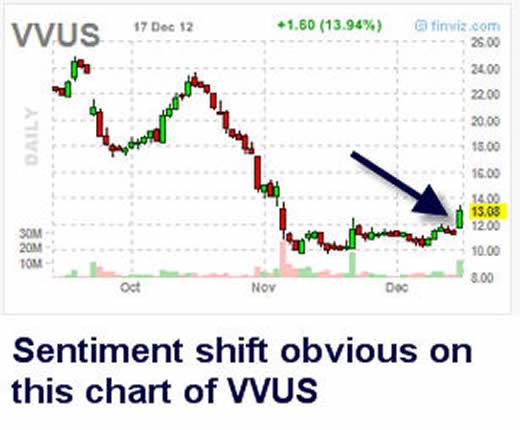
Below we have a very recent sample 3 day rest B Wave pattern in a stock my firm recommended prior to a 15% one day move a few days after we alerted it, this being Vivus (VVUS). This produced an 11% net gain inside of 4 trading days after a 15% one day pop C wave rally. The two charts below show the 10 day chart with the 3 day rest pattern which we scaled into, and then the C wave to the upside. Also shown is a longer term chart where you can see the pattern as well. We traded this same pattern in ANR recently for 9-11% gains inside of 48 hours as well.
If you’d like to learn more about trading sentiment and catalysts for profitable Swing Trading, then join us at ATP. Go to ActiveTradingPartners.com and subscribe by using coupon code AD499ATP in the coupon code field at the bottom of the sign up form. Sign up for quarterly and the discount will be applied at checkout, and you will get The Market Trend Forecast for free as well.
Dave Banister
CIO-Founder
Active Trading Partners, LLC
www.ActiveTradingPartners.com
TheMarketTrendForecast.com
Dave Banister is the Chief Investment Strategist and commentator for ActiveTradingPartners.com. David has written numerous market forecast articles on various sites (SafeHaven.Com, 321Gold.com, Gold-Eagle.com, TheStreet.Com etc. ) that have proven to be extremely accurate at major junctures.
© 2012 Copyright Dave Banister- All Rights Reserved
Disclaimer: The above is a matter of opinion provided for general information purposes only and is not intended as investment advice. Information and analysis above are derived from sources and utilising methods believed to be reliable, but we cannot accept responsibility for any losses you may incur as a result of this analysis. Individuals should consult with their personal financial advisors.
© 2005-2022 http://www.MarketOracle.co.uk - The Market Oracle is a FREE Daily Financial Markets Analysis & Forecasting online publication.