


U.S. Boomer Demographics and the Unemployment Rate
Economics / Demographics Dec 16, 2012 - 11:52 AM GMTBy: Mike_Shedlock

 A week ago in Startling Look at Job Demographics by Age I posted the following chart made with data that I downloaded from the St. Louis Fed.
Employment Demographics by Age Group
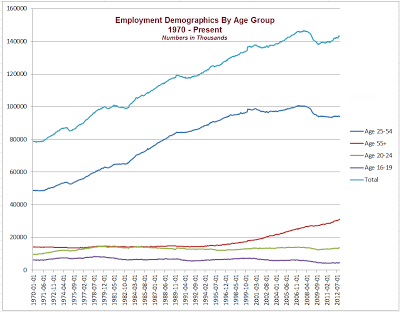
One person suggested the chart was "very misleading" because it did not properly reflect the aging workforce.
However, I did comment at the time 'Boomer demographics certainly explains "some" of this trend'.
I could not quantify the amount at the time because there was no civilian population data on the St. Louis Fed website (at least that I could find).
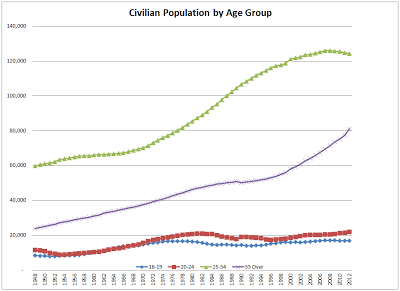
Since then, I asked my friend Tim Wallace to see what he could come up with, and with a few calls to the BLS he did get the population data from which we could make more accurate assessments. Here are the key comparisons.
2007 vs. Now for Age Group 25-54
•In 2007, the Civilian Noninstitutional Population for age group 25-54 was 125,978,000
•Currently the Civilian Noninstitutional Population for age group 25-54 is 124,248,000
•In 2007, Employment in age group 25-54 was 101,083,000
•Currently, Employment in age group 25-54 is 94,523,000
•Since 2007, the Civilian Noninstitutional Population for age 25-54 declined by 1,730,000
•Since 2007, Civilian Employment declined by 6,560,000
Quantification of "Some"
I can now quantify "some" more precisely: 279% of the decline in employment in age group 25-54 between 2007 and now is due to economic weakness as opposed to shifting demographic trends.
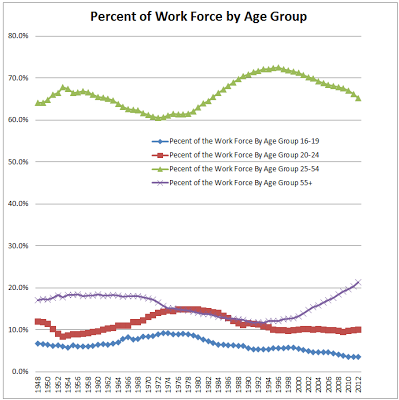
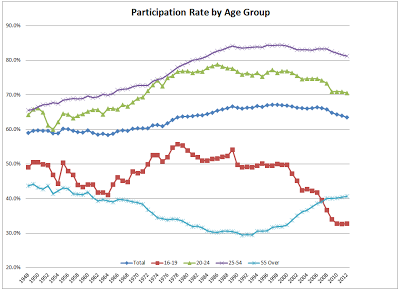
Here is a collection of interesting jobs charts by reader Tim Wallace.
click on any chart for sharper image
Civilian Population by Age Group
Percent of Work Force by Age Group
Participation Rate by Age Group
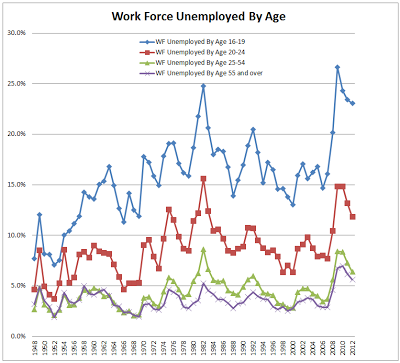
Work Force Percent Unemployed by Age Group
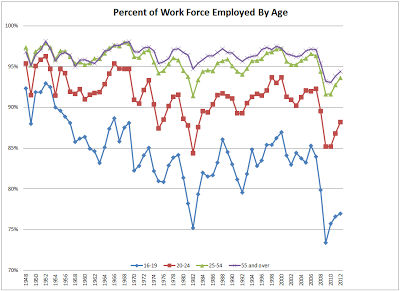
Percent of Work Force Employed by Age Group
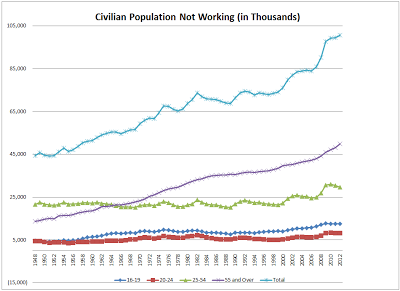
Civilian Population Not Working by Age Group
Thanks Tim!
Definitions and Notes
•The participation rate is the ratio of the civilian labor force to the total noninstitutionalized civilian population 16 years of age and over.
•The noninstitutionalized civilian population consists of civilians not in prison, mental facilities, wards of the state, etc.
•The labor force consists of those who have a job or are seeking a job, are at least 16 years old, are not serving in the military and are not institutionalized.
•There are strict requirements on what constitutes "seeking a job". Reading want-ads or jobs on "Monster" does not count. One actually needs to apply for a job, go on an interview, or send in a resume.
•Please see Reader Question Regarding "Dropping Out of the Workforce" for an explanation of how the BLS determines someone is actively seeking a job.
The final chart above shows the number of people in each age group that is not working. Recall that, "not working" and "unemployed" are different things.
I would prefer a more simple definition of unemployment: those who want a job but do not have one. Instead, we have definitions that purposely mask (by many millions) the current sorry state of affairs.
By Mike "Mish" Shedlock
http://globaleconomicanalysis.blogspot.com
Click Here To Scroll Thru My Recent Post List
Mike Shedlock / Mish is a registered investment advisor representative for SitkaPacific Capital Management . Sitka Pacific is an asset management firm whose goal is strong performance and low volatility, regardless of market direction.
Visit Sitka Pacific's Account Management Page to learn more about wealth management and capital preservation strategies of Sitka Pacific.
I do weekly podcasts every Thursday on HoweStreet and a brief 7 minute segment on Saturday on CKNW AM 980 in Vancouver.
When not writing about stocks or the economy I spends a great deal of time on photography and in the garden. I have over 80 magazine and book cover credits. Some of my Wisconsin and gardening images can be seen at MichaelShedlock.com .
© 2012 Mike Shedlock, All Rights Reserved.
Disclaimer: The above is a matter of opinion provided for general information purposes only and is not intended as investment advice. Information and analysis above are derived from sources and utilising methods believed to be reliable, but we cannot accept responsibility for any losses you may incur as a result of this analysis. Individuals should consult with their personal financial advisors.
Mike Shedlock Archive |
© 2005-2022 http://www.MarketOracle.co.uk - The Market Oracle is a FREE Daily Financial Markets Analysis & Forecasting online publication.