Credit Crunch Contagion Could Turn into Japan Style Asset Price Deflation
Stock-Markets / Credit Crisis 2008 Feb 25, 2008 - 09:51 AM GMTBy: Captain_Hook

 The Irony Of It All - Toxic credit crunch contagion continues to spread, silently kicking the stuffing out of the economy faster than people think. Whether you want to talk about credit cards , corporations , or commercial real estate – the credit crunch is spreading, and beginning to look nastier all the time. You should know that when banks begin to fail in the States, and they will, things could spiral out of control to the extent controls will to need be placed on both digital and physical movement. Transfers between banks will cease up completely, debts will be called in (so pay them off now), systems from food distribution to medical care will break down, and Martial Law will be the result as the population retaliates. Life will change as you know it.
The following is an excerpt from commentary that originally appeared at Treasure Chests for the benefit of subscribers on Tuesday, February 12th , 2007.
And if that's not enough, you should know things in the East might not be as rosy as some people think either, and that they are ready to join in the credit crunch contagion. Of course Japan has never really escaped the credit crunch that gripped their economy back in the 90's after bubblizing the real estate market. That's the tell-tale-sign a bubble economy is on its last legs you know – when master planners need resort to bubblizing the real estate market. Generally it's all down hill after that on a secular (long-term) basis because this is a reflection of not just a turn in the larger credit cycle; but more, and the driver of credit growth in the end, this is the signal demographic constraints have turned negative. Harry Dent is not wrong in this regard. It's a simple numbers game, where an aging population is less prone to take on debt.
So, wouldn't it be ironic if the West went into a Japanese style asset deflation starting about now then? Wouldn't that surprise a lot of people, not the least of which being Wall Street barkers / economists that keep telling us this is not possible. Wouldn't that be ironic after all the attention that's been paid to making sure nothing like this ever happens again, with the placement of Helicopter Ben at the Fed's helm to ensure such an outcome is avoided. Wouldn't all of this be ironic to the dispassionate observer looking down on the situation?
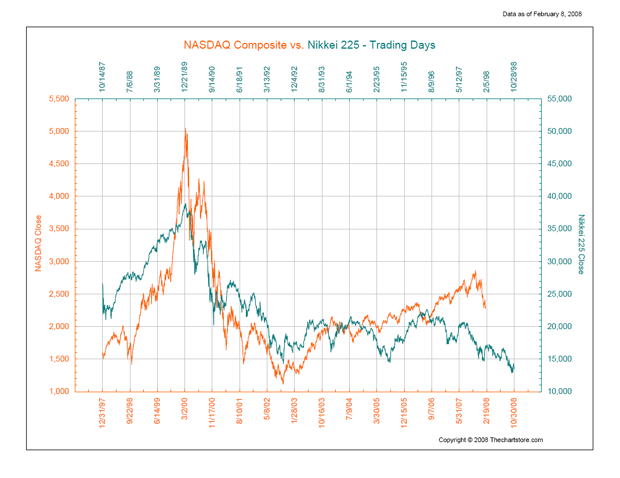
Past this however, and perhaps the real irony of the situation, is if we are suppose to know so much these days, more than those back in the 20's and 30's that managed the US into a Depression, and more recently in Japan, then why was Greenspan and company allowed to bubblize the global economy for the benefit of so few – why? This to me is the irony in the larger situation. And if the chart below holds any predictive value, many more overly confident participants in Western stock markets might soon share such sentiment as they are sheered like sheep if this pattern divergence is closed. (See Figure 1)
Figure 1
Source: The Chart Store
Add to all this an unfolding bond market debacle , where the bid for US government debt has been temporarily bolstered by the subprime mess, and a recipe for disaster appears complete with the possibility of both stocks and bonds falling in unison at some point not far off. This of course would be quite different from what happened in Japan , where they have been able to keep inflating their economy, and the world via the Yen Carry Trade , with essentially zero-percent interest rates due to high savings rates. Unfortunately for the States however, they have no savings, and increasingly fewer friends these days for one reason or another . The only hope here is monitization , and that's exactly what they are doing already, in spades .
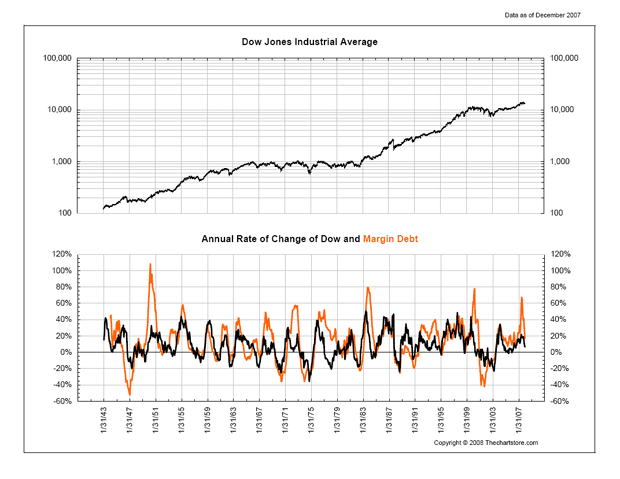
So, the question becomes ‘what about when demand – both domestic and foreign – dries up for US government debt, and in spite of monetization efforts, market rates begin to rise anyway?' For me, the answer to this question is ‘nothing good'; especially considering in spite of low rates right now the home-equity backed ATM machine is already on the fritz. Again then, it should be recognized the larger credit cycle is done (watch for continued strength in the Yen to confirm this thinking), with potentially increasing swings in stocks going both ways as effects of the pseudo-stagflation runs its course, and deflation grips the macro. In this regard a clear break lower in margin debt thresholds would be the straw that breaks the camel's back, as the stock market is the only hope left master planners have to generate positive inflation dynamics. So, it will be interesting to see what happens in the next reporting period at quarter end. (See Figure 2)
Figure 2
Source: The Chart Store
And as you know from previous discussion on the subject, if market players have had it with margin, this means circumstances will likely come together to sponsor crashing stocks this quarter, with many thinking deflation is just around the corner as a result. Of course the only problem with this thinking is while this is happening gold is going through the roof, which tells us to expect one hell of a bounce in the larger equity complex once stars are aligned, possibly sending not only stocks back up, but commodities to the moon, and bonds into the basement as per above. In the believe it or not category, look for an ECB rate cut to possibly trigger a real meltdown in stocks resulting from the Euro going through the floor against both the Yen and dollar ($). This is why European master planners continue to babble about the risks of inflation while the rest of the developed world is cutting rates – to prevent the Yen Carry Trade from unraveling.
This is why we most likely will not see such a move until after stocks are more washed out combined with commodity prices heading the other way. In gauging this probability, I updated the Markets Chest over the weekend and came across a few important observations I would like to share with you. First, it should be noted the Daily SPX bounces off long-term channel support at the lows last month, meaning going below this mark (approximately 1270) would break channel support, ushering in the possibility of far lower levels. In this regard just about every trader on the planet is expecting a test of the lows, and most are expecting it to be successful. As you may have deduced then, this means many will likely cover shorts / puts at such a juncture, which in effect would enable the move lower. In this regard you should know that in a word, the Monthly SPX is ‘broken', and Weekly SPX indicators are testing break downs, which should result in lower prices – potentially significantly lower prices.
Then take a gander at the ‘crash signature' in the XLI (Industrials) , meaning On Balance Volume (OBV) is collapsed juxtaposed to an seriously bullish investing population in that the Accumulation / Distribution Indicator is plumbing the highs. And although not as pronounced, you should know ‘crash signatures' (OBV divergently lower than Accumulation. / Distribution) are present in the major indexes across all measures from dailies to weeklies. What's more, if they don't have this problem, other sectors such as financials and semiconductors currently reside on structural support, where it wouldn't take much to push them over the edge. You see, people are buying stocks here because they need the money for income (making them despirate), not because of investment merits, which is why stock markets can crash once the mechanism (short squeeze) that supports prices runs its course. In essence, the ‘stupids' get caught and need to bail out at the same time when stops are hit.
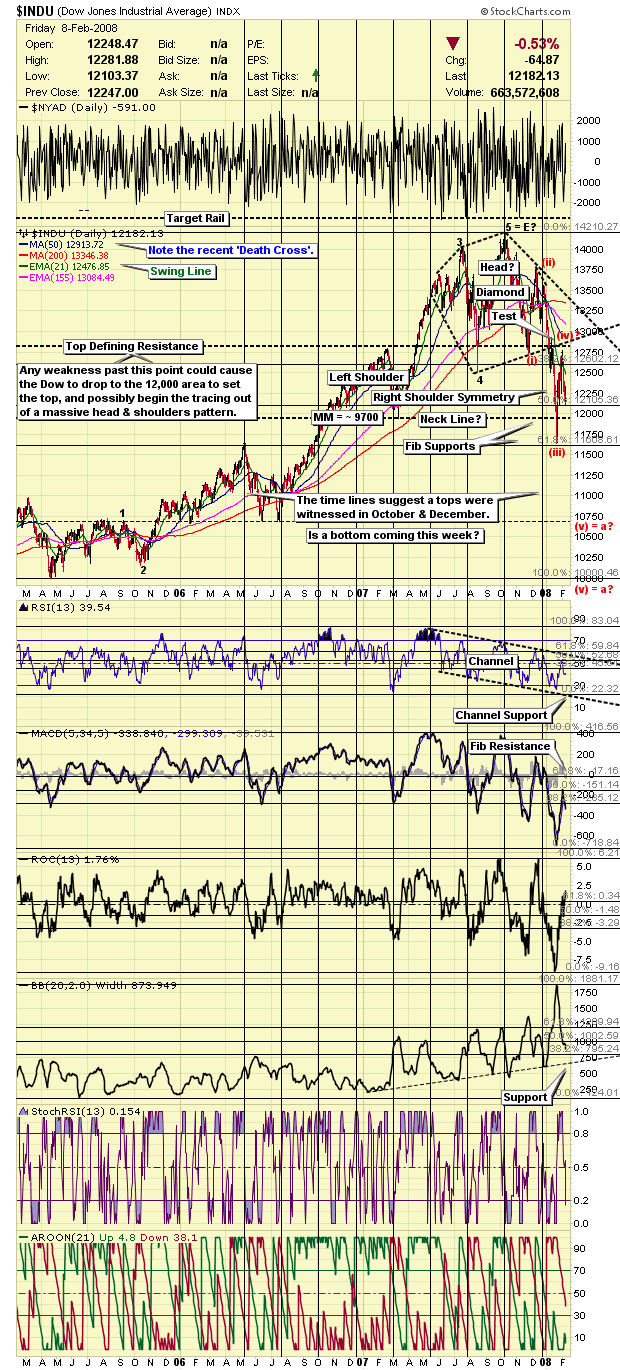
Based on this understanding then, it should be no surprise the Dow (and SPX) is tracing out a rather large head and shoulders pattern that might actually get triggered and trace out if bearish speculators are actually exhausted and don't short at the neckline this time around. As you can see below, if this were to occur, a move down into the 10,000 area would be the result. (See Figure 3)
Figure 3
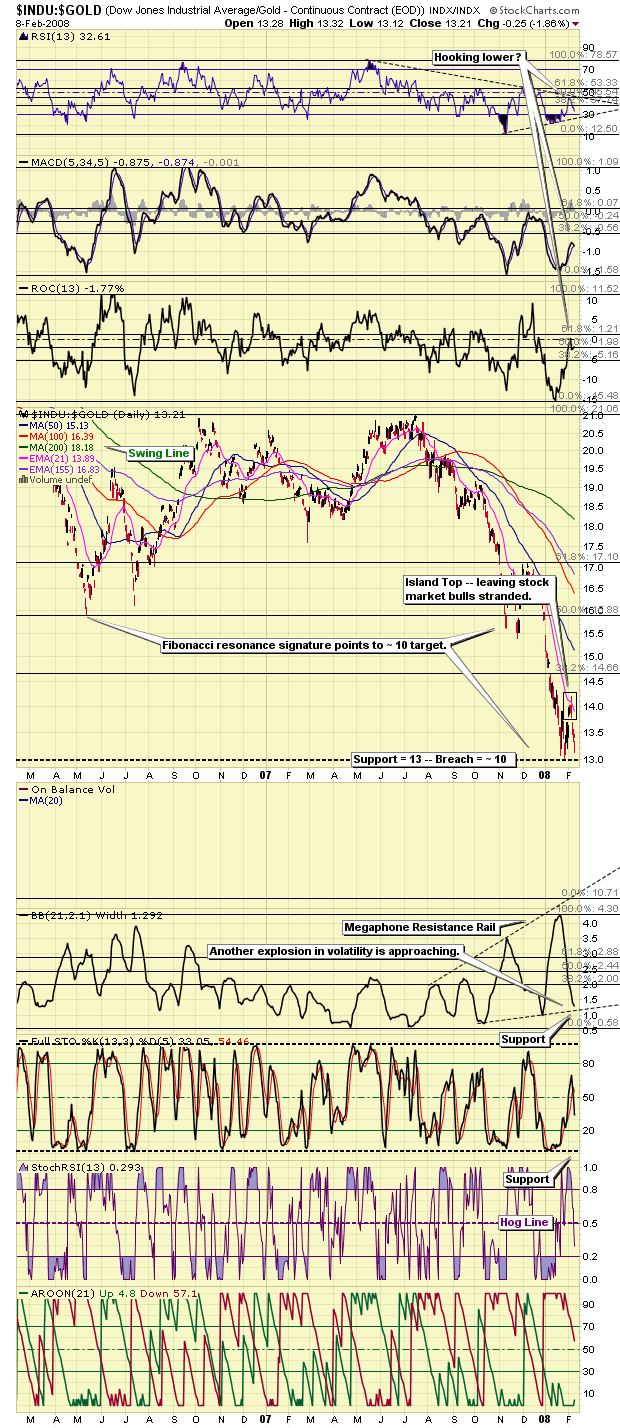
Of course this should be old news to you, where based on previous commentary one should already be tuned into prospects for the Dow / Gold Ratio heading down into the 10 area in coming days. What you may not know however, but equally significant in flipping this ratio around, is the Gold / Dow Ratio is about to break above the 233-exponential MA on the monthly plot, which will officially mark the long-term trend change. What's more, a significant breakout like this would also suggest a big move should accompany such an event. Thus, it's now far easier to see why the Dow / Gold Ratio is likely heading to 10ish over the course of the next month or so, potentially characterized by gold at $1000, and the blue chips vexing 10,000. Here is a close-up snapshot of the Dow / Gold Ratio that demonstrates such a move is quite possible from a technical perspective. (See Figure 4)
Figure 4
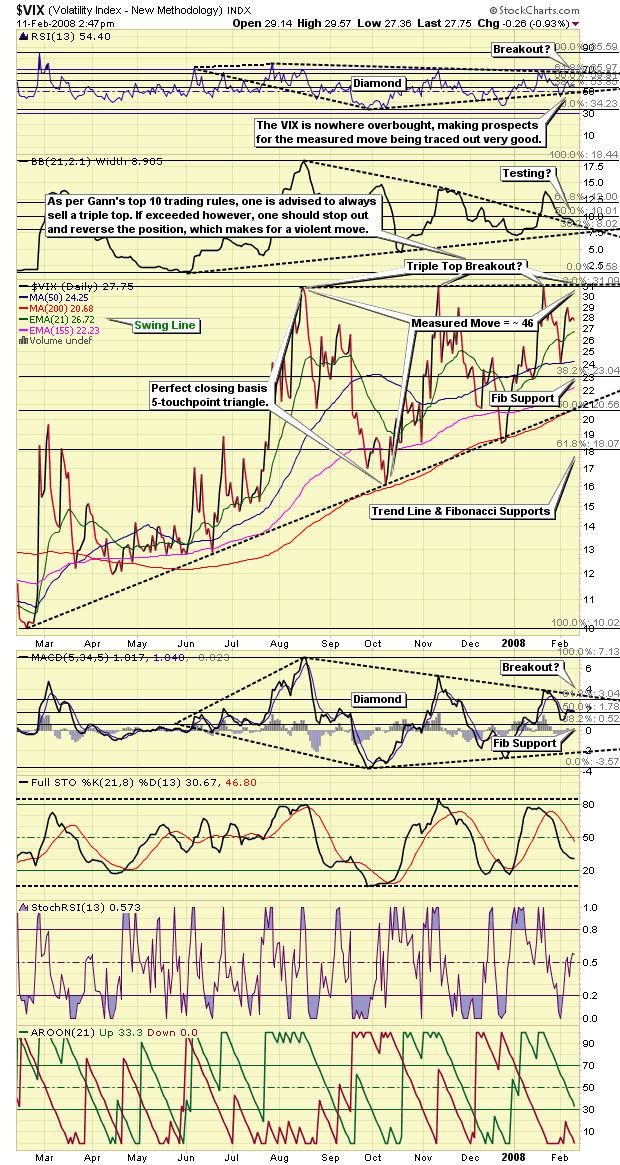
Oh yes, we must not forget about mentioning the CBOE Volatility Index (VIX) is attempting to broach closing basis triple top resistance at 31, as can be seen here on the daily plot . Based on the fact we have diamonds in the stochastics, which is rare, the chances of this occurring are exceptional, which would sponsor a move to 45 minimally, where once above this level, and as denoted on the monthly , who knows what happens after that if highs seen during the tech bubble meltdown are exceeded. (i.e. the VIX went to150 in 1987.) Again, here is a closing basis close-up snapshot of the VIX showing triple top resistance very clearly. A breakout here, and subsequent rout in stocks could come anytime based on the fact the VIX is not overbought in the least. (See Figure 5)
Figure 5
Unfortunately we cannot carry on past this point, as the remainder of this analysis is reserved for our subscribers. However, if the above is an indication of the type of analysis you are looking for, we invite you to visit our newly improved web site and discover more about how our service can help you in not only this regard, but on higher level aid you in achieving your financial goals. For your information, our newly reconstructed site includes such improvements as automated subscriptions, improvements to trend identifying / professionally annotated charts , to the more detailed quote pages exclusively designed for independent investors who like to stay on top of things. Here, in addition to improving our advisory service, our aim is to also provide a resource center, one where you have access to well presented ‘key' information concerning the markets we cover.
On top of this, and in relation to identifying value based opportunities in the energy, base metals, and precious metals sectors, all of which should benefit handsomely as increasing numbers of investors recognize their present investments are not keeping pace with actual inflation, we are currently covering 68 stocks (and growing) within our portfolios . This is yet another good reason to drop by and check us out.
And if you have any questions, comments, or criticisms regarding the above, please feel free to drop us a line . We very much enjoy hearing from you on these matters.
Good investing in 2008 all.
By Captain Hook
http://www.treasurechestsinfo.com/
Treasure Chests is a market timing service specializing in value-based position trading in the precious metals and equity markets with an orientation geared to identifying intermediate-term swing trading opportunities. Specific opportunities are identified utilizing a combination of fundamental, technical, and inter-market analysis. This style of investing has proven very successful for wealthy and sophisticated investors, as it reduces risk and enhances returns when the methodology is applied effectively. Those interested in discovering more about how the strategies described above can enhance your wealth should visit our web site at Treasure Chests
Disclaimer: The above is a matter of opinion and is not intended as investment advice. Information and analysis above are derived from sources and utilizing methods believed reliable, but we cannot accept responsibility for any trading losses you may incur as a result of this analysis. Comments within the text should not be construed as specific recommendations to buy or sell securities. Individuals should consult with their broker and personal financial advisors before engaging in any trading activities, as we are not registered brokers or advisors. Certain statements included herein may constitute "forward-looking statements" with the meaning of certain securities legislative measures. Such forward-looking statements involve known and unknown risks, uncertainties and other factors that may cause the actual results, performance or achievements of the above mentioned companies, and / or industry results, to be materially different from any future results, performance or achievements expressed or implied by such forward-looking statements. Do your own due diligence.
Copyright © 2008 treasurechests.info Inc. All rights reserved.
Unless otherwise indicated, all materials on these pages are copyrighted by treasurechests.info Inc. No part of these pages, either text or image may be used for any purpose other than personal use. Therefore, reproduction, modification, storage in a retrieval system or retransmission, in any form or by any means, electronic, mechanical or otherwise, for reasons other than personal use, is strictly prohibited without prior written permission.
Captain Hook Archive |
© 2005-2022 http://www.MarketOracle.co.uk - The Market Oracle is a FREE Daily Financial Markets Analysis & Forecasting online publication.


