Warning For Gold From Inflation, U.S. Dollar, And Mining Stocks!
Commodities / Gold and Silver 2012 Dec 15, 2012 - 11:01 AM GMTBy: Sy_Harding

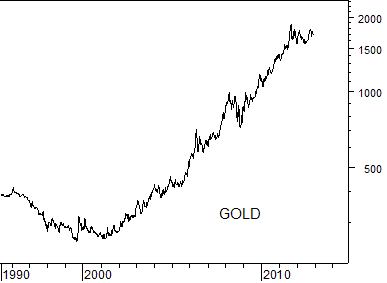
 Historically gold has been seen as a safe haven in times of rising inflation. No surprise then that it’s been in a long and impressive bull market since 2002, when a string of significant events began that were expected to create a substantial surge in inflation.
The 2001 recession resulted in significant monetary easing by the Fed in an effort to re-stimulate the economy. The 9/11/01 terrorist attacks resulted in dramatic increases in government spending on Homeland Security and the subsequent invasions of Afghanistan and Iraq.
Those were enough to get gold going in anticipation of expected spiraling inflation. The price of gold doubled from $250 an ounce in 2002 to $500 by 2005.
The inflationary expectations continued when previous federal budget surpluses turned to growing deficits as the wars were ramped up while revenues from taxes fell as the economy continued to struggle. Inflation had still not shown up to any degree but it seemed sure to do so at any time. So gold continued to attract unusual buying. By 2008 its price had doubled again to $1,000 an ounce.
At that point the 2008 financial crisis hit. Government deficit spending increased again as massive stimulus efforts were undertaken to prevent the subsequent recession from worsening into the next Great Depression.
And gold almost doubled again, reaching $1,900 an ounce last year.

But still the soaring inflation expected for a dozen years has not arrived, at least in the U.S.
During the decade of the 1990’s, inflation as measured by the Consumer Price Index averaged 2.8% annually. In the dozen years since 2001 it has averaged 2.5% annually. Over the past year is has averaged only 1.8%.
The last time gold enjoyed a huge bull market was in the 1970’s when inflation was truly spiraling higher in a struggling economy. Gold surged to a then record ‘bubble’ peak of $850 in 1979. But inflation averaged 7.7% annually in the 1970’s decade, and reached a high of 13.6% in 1981.
Gold is also considered a hedge against declines in the value of currencies, particularly the U.S. dollar.
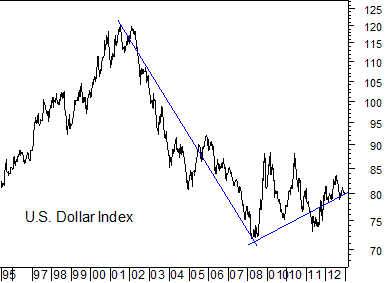
So the dollar’s plunge beginning in 2002 was also supportive of gold’s long bull market. The U.S. dollar peaked in 2002 at 120. By 2008 it had plunged to 71.

Meanwhile, unlike other commodities, gold is not consumed. It is not eaten or burned as fuel. All the gold that has ever been mined remains in existence. It is sought after and saved when its price is rising in anticipation of rising inflation, or on concerns created by the collapse of currencies.
And in the final stage of long bull markets in any asset, prices often continue to rise further for no other reason than that they have been rising so dramatically for so long, making investors confident they can extend expectations for more gains in a straight line into the future, rather than thinking cycles.
Given that it’s been 12 years and the expected inflation has not shown up, and indications that the dollar’s multi-year plunge may have bottomed in 2008, gold may well be in that final stage where its fundamental supports are no longer there and its price is being maintained by speculative investors.
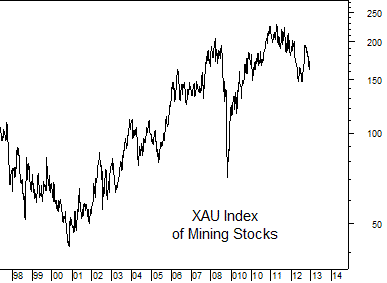
Another warning may be coming from the gold-mining stocks. Gold bullion is only down $200 an ounce, 10%, since its peak at $1,900 an ounce last year. However, gold-mining stocks, which often lead the bullion in both directions, began their long bull market in 2001, a year before the bull market in bullion began, and potentially topped out in March of last year, having plunged 29% since.

At Street Smart Report our technical indicators have been on a sell signal on gold since October, with a downside target of $1,670 an ounce, the level of its important 30-week moving average. If it finds support there we could get another buy signal for another rally.
But if that support does not hold, it could be ominous for gold, given that two main reasons for its long bull market (the threat of inflation, and the plunging dollar) may no longer be there, leaving its main support over the last year or so as mostly speculative fever, and even it may be waning given the $200 an ounce decline from its peak at $1,900.
Something to think about before jumping more aggressively into gold on the belief that this dip too is just another buying opportunity.
Sy Harding is president of Asset Management Research Corp., and editor of the free market blog Street Smart Post.
© 2012 Copyright Sy Harding- All Rights Reserved
Disclaimer: The above is a matter of opinion provided for general information purposes only and is not intended as investment advice. Information and analysis above are derived from sources and utilising methods believed to be reliable, but we cannot accept responsibility for any losses you may incur as a result of this analysis. Individuals should consult with their personal financial advisors.
Sy Harding Archive |
© 2005-2022 http://www.MarketOracle.co.uk - The Market Oracle is a FREE Daily Financial Markets Analysis & Forecasting online publication.


