


Has Apple Stock Peaked?
Companies / Tech Stocks Dec 12, 2012 - 03:16 AM GMTBy: Submissions

 Timothy Lutts writes: Has Apple (AAPL) Stock Peaked?
In the Footsteps of Coca-Cola
The Next Apple?
Everybody knows Apple.
With more than 85 million iPhones sold, $156 billion in annual revenues and a market capitalization that recently hit $660 billion, Apple is the second most respected brand on the planet. Number one is Coca-Cola.
But what does that mean for investors?
It means there’s a chance that investor perception of the company is so high that all the big investors already own as much Apple as they can carry. It means there’s more potential selling pressure on Apple’s stock than buying pressure. And that means there’s a good chance the stock has topped!
Now, some investors, looking at numbers alone, will disagree.
They’ll point out that the company is still growing fast, that the third quarter saw revenues grow 27%, and earnings grow 23%, and that analysts are expecting 12% growth in 2013 and 18% in 2014. Then they’ll point to the stock’s forward PE ratio of 12 and say, “Apple is cheap!”
But using numbers alone is a mistake in evaluating growth stocks, particularly exceptional growth stocks like Apple.
For example, we at Cabot did very well recommending Amazon.com way back when the company (selling only books) was still unprofitable, and most bean-counters wouldn’t touch it with a 10-foot pole. We jumped on little Crocs (plastic shoes!) and rode it to the moon. And we did very well with ridiculously “expensive” First Solar, in part because we sold early, while its business was still booming, but its stock was on the skids. We could have justified owning none of those stocks if all we looked at were numbers.
Bottom line: to make money in exceptional growth stocks, you can’t just look at numbers; you’ve also got to look at momentum and sentiment.
But before I get deeper into Apple’s case, I want you to study this long-term chart of Coca-Cola (KO) (the number one brand in the world today), spanning the years from 1965 to the end of 1985.
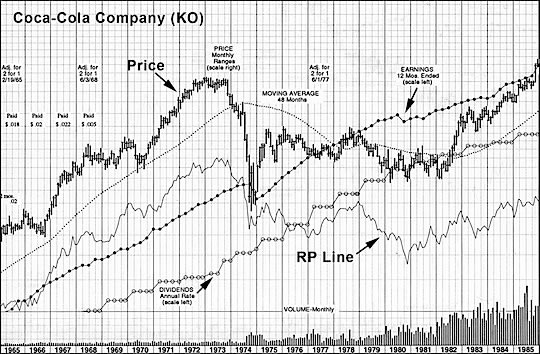
WONDA® Copyright© 2012 William O’Neil + Co., Inc. All rights reserved. Unauthorized duplication, modification, photocopying or distribution in any form is strictly prohibited.
Note the earnings line, with each dot marking a quarterly earnings figure. It’s a steady uptrend, with the exception of a sharp dip in late 1974 and a stumble in 1981-1982. Then look at the dividend line; Coke’s dividends were increased every year, like clockwork. Finally, observe the price line, noting that Coke’s price peaked in late 1972 and didn’t exceed that level until late 1985, 13 years later.
The explanation for those “lost 13 years” lies not in the numbers; it lies in crowd psychology, and specifically, in the investing environment of the times. Coca-Cola was one of the Nifty Fifty, popularly regarded as one-decision stocks that you would simply buy and hold forever. (Others in this august group included Digital Equipment, Eastman Kodak, J.C. Penney and Simplicity Pattern).
Well, for investors who truly had the patience and guts to hold Coke through those lost 13 years, it worked out okay. But most investors don’t work with that kind of time horizon. Most investors can’t hold five years without seeing a profit—and they shouldn’t have to!
The truth is, the extreme popularity of those stocks (call it reverence, even), was a sign of their potential to top. But it was very hard for investors to see it then!
So, getting back to Apple, I’ve already mentioned the stock’s high regard among the general public; it’s the number two brand in the world. Among institutional investors, it’s regarded as royalty, providing both a dividend and spectacular growth. In fact, if you manage institutional money, owning AAPL has become almost a requirement in recent years, and the result of all that buying power is that even after the recent correction, AAPL is still up 45% for the year!
But when everyone who might buy a stock has bought it, what happens?
The same thing that happened to Coca-Cola in 1972. It stops going up, and to some extent—every stock is different—it goes down.
Now, I have no doubt that Apple (the company) will continue to grow revenues and earnings for years to come. I’ve been an Apple user since 1987, when I bought a Macintosh SE for Cabot (to join our IBM Displaywriter—Google that!). Today I use a MacBook Pro, an iPad and an iPhone on a daily basis, and I expect to be an Apple user to the day I die, benefiting from the company’s legendary ability to make complicated technological interactions simple. Nevertheless, I’m bearish on Apple (AAPL) stock today and here’s why.
There’s a dirty word to describe what happens when a company’s growth slows, and when the perception of the company’s future becomes just slightly tarnished. As that word spreads, and as those perceptions spread, the stock slowly collapses, as the supply of stock (potential sellers) overwhelms demand (potential buyers).
---
The Dirty Word
The word is deceleration, which is a fancy phrase for slowing down. And Apple is decelerating! That third quarter earnings growth of 23% followed second quarter earnings growth of 20%. Those were the slowest quarters since mid-2009! And looking forward, the projected 12% growth in 2013 is even slower, though 18% for 2014 provides hope.
Now, 12% growth is nothing to sneeze at; many companies would kill for 12% growth. And 18% is excellent! But it’s quite a comedown from the nine consecutive quarters from 2010 into 2012 where Apple’s earnings grew more than 50%! It’s deceleration. And that brings us to the stock’s performance, which is where the rubber meets the road. Because more important than numbers, more important than sentiment, is the stock’s actual performance. So here’s Apple’s chart, since the 2009 bottom.
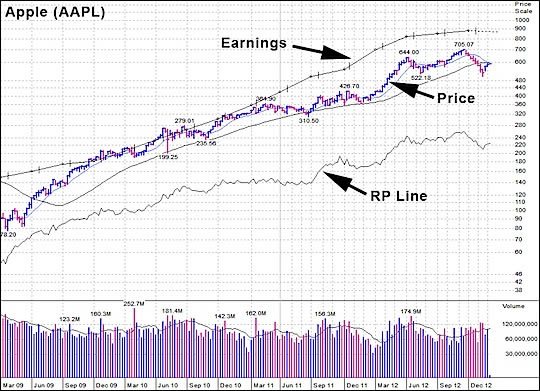
WONDA® Copyright© 2012 William O’Neil + Co., Inc. All rights reserved. Unauthorized duplication, modification, photocopying or distribution in any form is strictly prohibited.
As on Coke’s chart, you see the earnings line, trending higher, but rounding somewhat recently; that’s the deceleration of earnings. There’s no dividend line on this chart; Apple’s dividend history is short but healthy. But there is another line on this chart and that’s the RP line. RP stands for Relative Performance; it depicts the performance of the stock relative to the broad market.
Note that over the past four years, whenever AAPL corrected, its RP line basically flattened out (ignoring the tiny weekly movements). But in this year’s correction, AAPL’s RP line turned down, and for eight weeks, AAPL performed worse than the overall market.
Now, this underperformance alone is not the kiss of death. Many stocks can pull out of similar corrections and move out to new highs.
But look back at Coke’s chart. If you look at the RP line, you’ll see the same pattern! From 1964 through 1973, KO was pretty healthy, beating the broad market overall, and holding its own in corrections. But after 1973, as sentiment turned, and the selling pressures slowly overwhelmed buying pressures, KO’s RP turned clearly negative, beginning a pattern that lasted many years longer than most investors could stomach
And that’s very likely where AAPL is today.
So when you put it all together…
• The extremely high market cap
• The extremely positive public opinion
•The extremely high level of institutional ownership
• The deceleration of earnings growth
• The weakening relative performance line
…it looks ominous.
Now, big, well-respected stocks don’t collapse overnight. To the contrary; when a high-quality stock like Apple pulls back, you’ll hear a new chorus of “It’s a great value down here” and “Buy the dips.” But as time goes by, and the stock fails to return to its old highs, those choruses fade, and the stock falls slowly out of the limelight—just like Coca-Cola did in the 1970s.
Stepping back to look at the big picture, it’s worth remembering that investing is not a science. Uncertainty is a given.
But to be a successful investor, you need to put the odds in your favor, and today, the odds are not good for investors in Apple.
But the odds are good if you invest in companies with the potential to be the next Apple, and you can read more on that below.
-- Advertisement --
Get My December Stock of The Month Free!
Here's why I want you to have it:
- It represents the best stock in the market across all sectors
- It matches the exact same profit profile that led us to a 670% gain in Broadvision, a 500% profit in Intuitive Surgical, and a 1290% gain in Amazon.com, and
- It has already handed investors a 40% gain year-to-date
- It's technically ready to break out and notch another 15% to 20% gain in the next 30 days no matter what happens in the overall market.
You simply can't lose. Get more details here.
---
How do you find the next Apple?
For starters, you want a company that is not yet extremely popular, and a stock that has never been widely owned by institutions.
You want a company that is capable of getting very large, ideally by addressing a mass market. You want a company that’s well managed, though not necessarily making a profit yet.
Finally, you want a company whose stock is beating the market now!
This is an excellent indication that investors are accumulating shares, as their collective perceptions of the company’s earnings potential improve.
Here’s one to chew on.
It’s Stratasys (SSYS), a leader in the up-and-coming field of 3-D printing.
What’s 3-D printing?
3-D printing enables a user working from a digital file to quickly create a real 3-D item.
There are two techniques used by Stratasys. One is fused deposition modeling, which works roughly like an inkjet printer, but builds up layers. The other is extrusion. Both have their advantages. All told, Stratasys machines can build with 120 materials, including over 100 proprietary photopolymer materials and 10 thermoplastic materials.
Plus, the company has more than 500 patents (granted and pending), which is a great barrier to entry.
Located in Minnesota, the company has been in business since 1989 and has grown revenues every year of the past decade except one (2009).
Its after-tax profit margins hit a record high 17.5% last quarter.
And the stock is looking strong!
Yet there’s very little buzz about 3-D printing, and even less buzz about Stratasys!
Big users of the technology today are in the aerospace, automotive and industrial sectors, often making prototypes of new designs. 3-D printing has replaced many a skilled machinist.
But as costs come down, I see no reason that usage of the machines can’t broaden.
After all, there was a time when having a 2-D printer in your home was unimaginable. Can 3-D printing follow the same path, or will success for the industry come differently, by displacing current manufacturing techniques? The answer is unknown, which is normal.
But the stock’s strength says this is one worth looking at.
SSYS was recently recommended by Cabot Top Ten Trader, and you can stay updated on our latest opinion on the stock—while learning about other stocks with the potential to be the next Apple—by taking a no-risk trial subscription.
For details, click here.
Yours in pursuit of wisdom and wealth,
Timothy Lutts
President, Chief Investment Strategist, Editor of Cabot Stock of the Month
Timothy Lutts heads Cabot Heritage, one of America’s most respected independent investment advisory services, publishing 12 newsletters including the Cabot Benjamin Graham Value Letter to more than 250,000 subscribers around the world. Combining time-tested investing systems with expert editorial content, these newsletters serve not only to make readers richer investors but to make them better investors. Under Tim's leadership, Cabot has been honored numerous times by Timer Digest, Hulbert Financial Digest and the Specialized Information Publishers Association as among the top investment newsletters in the industry. Tim also edits Cabot Stock of the Month Report.
© 2012 Copyright Timothy Lutts - All Rights Reserved
Disclaimer: The above is a matter of opinion provided for general information purposes only and is not intended as investment advice. Information and analysis above are derived from sources and utilising methods believed to be reliable, but we cannot accept responsibility for any losses you may incur as a result of this analysis. Individuals should consult with their personal financial advisors.
© 2005-2022 http://www.MarketOracle.co.uk - The Market Oracle is a FREE Daily Financial Markets Analysis & Forecasting online publication.