Trouble Knocking On Stock Bull’s Door, An AAPL A Day?
Companies / Tech Stocks Dec 10, 2012 - 04:59 AM GMTBy: Michael_Noonan
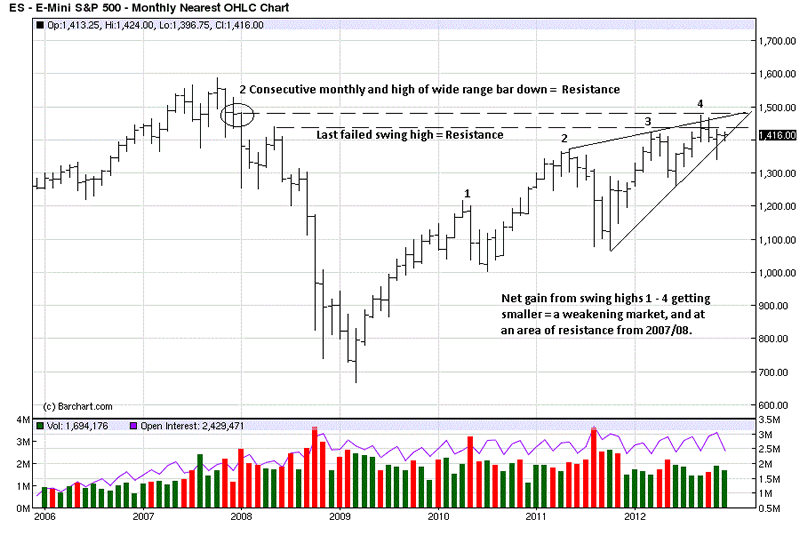
 Trouble appears to be brewing for a weakening bull trend in stocks. Starting with
the higher times frames, which are more controlling over daily and intra day, those
charts followed by most traders, we see a rising wedge that is indicating a trend
running out of demand effort. [A similar "wedge" situation was covered in our post
on "10 Year Note and Wheat - How To Find Trades, 2 December 2012, see Commentaries].
As swing highs 1 -4 show, the net upside gains are smaller and smaller, and what is important for the last one, point 4, is WHERE it is struggling. At the end of 2007 and early 2008, price declined precipitously and wiped out enormous amounts of market “value” and equity, much of which has not been recovered. Yes, the market has since rallied, but most of it has come from central bank ramping, the public having abandoned the market in droves, over a year ago.
The decline from the 2007 high to the early 2009 low took 17 months. The current rally is in its 45th month, a high at month 42, taking well over twice as long to recover not quite all gains lost. Ease of movement down, a labored recovery…not a good sign.
Even though price rallied above the March 2012 swing high, the horizontal line from that high is still in current play, as resistance, and the gain to the September high was only 55 points. The 5th, 6th, and 7th bar highs, from the right, are in the area of the March high and now acting as resistance, coming into this next week.
Each of the last three rally bars have been progressively smaller, a sign of demand struggling. The closes are all upper end of each bar, so we at least know that there is little supply, up to this point. That can change next day, next week, we do not know. Until it does change, weak as it is, the trend is chugging higher, of sorts. This is a caveat to longs and buyers, but zero reason to be short, from a risk/reward consideration. That, too, can change quickly in this environment. Be alert!
One more point worth noting. The give-back in this last swing down went deeper into the previous swing high, relative to the lesser give-back in the last up swing. It is another quality of character measure for the market, a weak one.
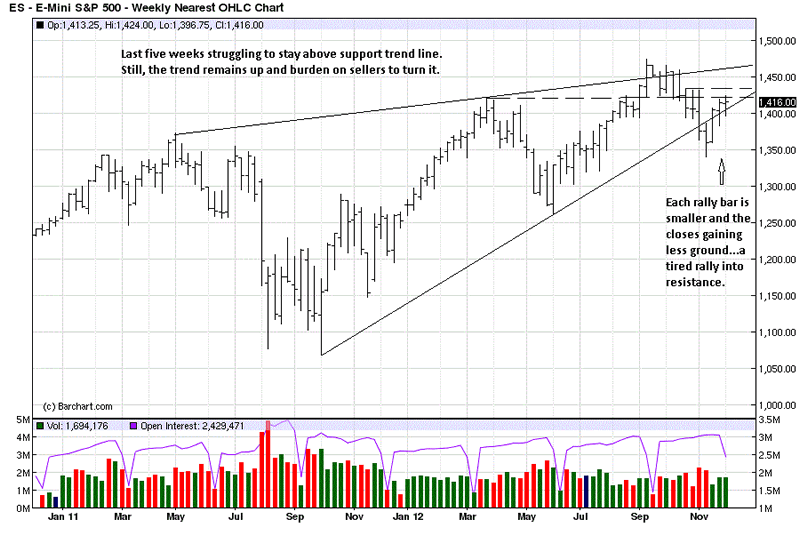
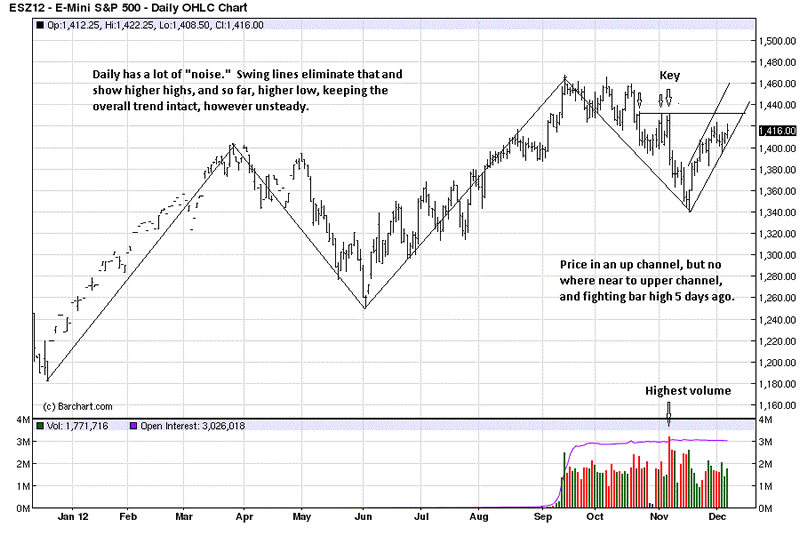
The synergy in all three time frames remains constant. This makes the read easier and more significant because of the consistency. On a broad overview, the swing lines cut through the daily “noise” to show higher highs and higher lows, the simplest definition of a trend. The current rally is in an up channel, laboring, but still in an up channel, and we always have to go with what is, not what “might” happen.
Getting into a little more detail, what stands out most is the high volume down bar from 7 November, third arrow labeled “Key.” It is. Why? Volume is a measure of effort. Here we have the highest volume that failed in a rally to a resistance area, with ease of movement to the downside, and a poor close. Sellers stampeded over buyers. In fact, this was the largest down bar for the contract. Widest bar down on the heaviest volume? This should grab anyone’s attention. It has ours.
The first market hurdle is rising above last Monday’s high, a smaller version of the 7 November bar, in that it offers resistance, and price closed off the high on Friday, when it neared that high of the week.
You can see from the weekly, above chart, that the close was in the upper part of the bar, but it was barely above the previous week, and the range was smaller, as we have been stating. Once/if it can clear that high, price will then be knocking on the door of the 7 November high.
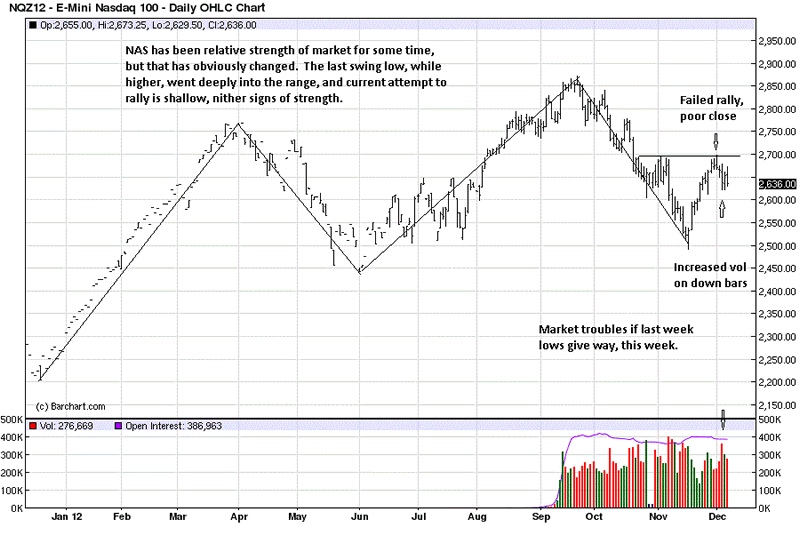
It is hard to be enthused about the market’s prospects, but we can never sell short the power of central planners’ ability to keep pumping fiat into a weakened market. One day, reality and gravity will take its natural course. A quick look at the Nasdaq does nothing to reassure the up trend.
The NAS has been the relative strength of this bull move, and compared to its weaker sister, SnP, it is flagging. The chart speaks for itself. While in an up trend, it is close to being a trading range situation. It is much closer to the June lows, when compared to the SnP.
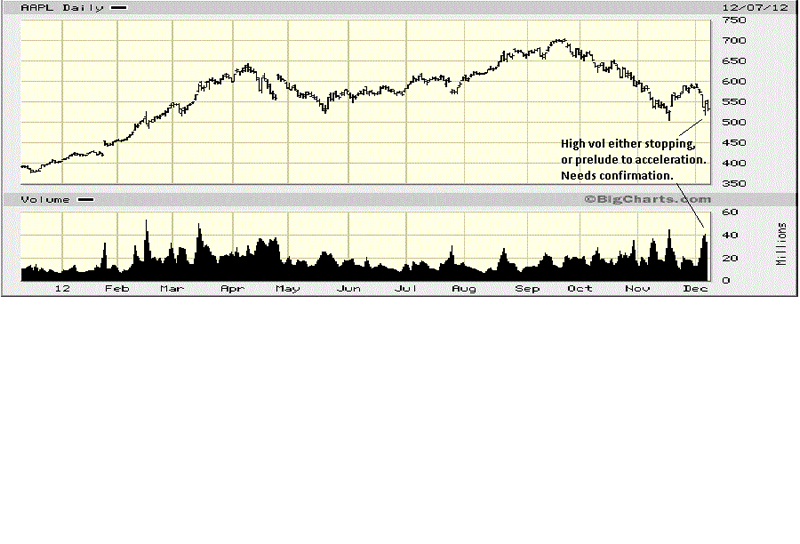
Friday’s bar held above the low of the week. If it holds, in the next few days, there is still life in the rally. If it gives way, there is little to justify remaining long in the market. For now, it seems as so goes AAPL, so goes the market.
AAPL is captured in the last paragraph above. The high volume effort last week is either stopping volume, as it was at the mid-November low, or the door to lower prices is about to be swung open.
For as negatively biased as we are on the stock market, we view the NAS and AAPL as offering a glimmer of hope, in the week coming. We can be wrong about that, but we are not long, so do not care. Nor are we short, just yet.
By Michael Noonan
Michael Noonan, mn@edgetraderplus.com, is a Chicago-based trader with over 30 years in the business. His sole approach to analysis is derived from developing market pattern behavior, found in the form of Price, Volume, and Time, and it is generated from the best source possible, the market itself.
© 2012 Copyright Michael Noonan - All Rights Reserved Disclaimer: The above is a matter of opinion provided for general information purposes only and is not intended as investment advice. Information and analysis above are derived from sources and utilising methods believed to be reliable, but we cannot accept responsibility for any losses you may incur as a result of this analysis. Individuals should consult with their personal financial advisors.
Michael Noonan Archive |
© 2005-2022 http://www.MarketOracle.co.uk - The Market Oracle is a FREE Daily Financial Markets Analysis & Forecasting online publication.


