


Energy Sector Storm Brewing – Oil & Gas Stocks
Companies / Oil Companies Dec 06, 2012 - 11:07 AM GMTBy: Chris_Vermeulen

 Oil and gas along with their equities have been underperforming for the most part of 2012 and they are still under heavy selling pressure.
I watch the oil futures chart very closely for price and volume action. And the one thing that is clear for oil is that big sellers are still unloading copious amounts of contracts which is keeping the price from moving higher. Oil is trading in a very large range and is trending its way back down the lower reversal zone currently. Once price reverses back up and starts heading towards the $100 and $105 levels it will trigger strong buying across the entire energy sector.
Crude Oil, Energy & Utility Sector Chart – Weekly Time Frame
The chart below shows the light crude oil price along with the energy and utilities sectors. The patterns on the chart are clearly pointing to higher prices but the price of oil must shows signs of strength before that will happen. Once XLE & XLU prices break above their upper resistance levels (blue dotted line) they should takeoff and provide double digit returns.
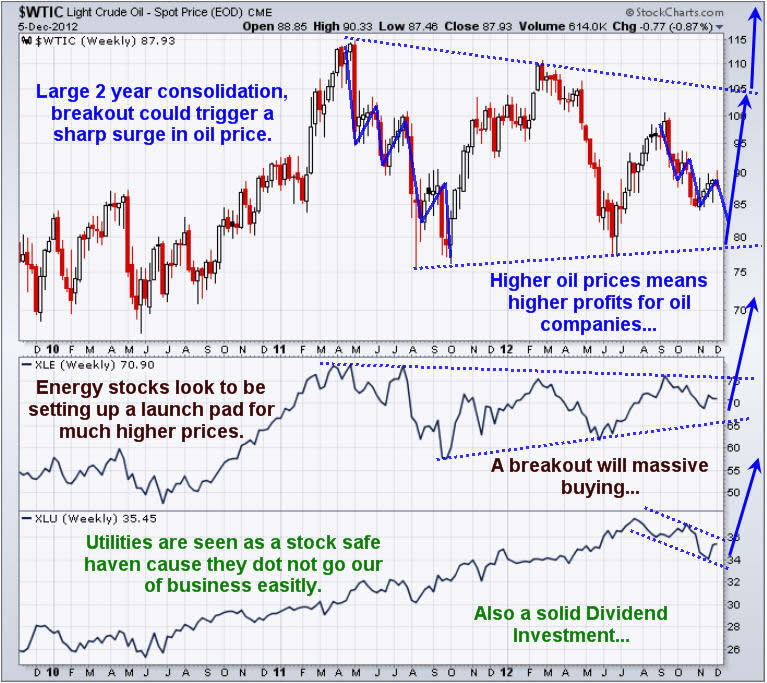
Looking at the XLU utilities sector above I am sure you noticed the steady rise in the price the last couple of years. This was a result in the low interest rates in bond price and a shift from investors looking for higher yields for their money. Utility stocks carry below average risk in the world of equities and pay out a steady and healthy dividend year after year. So this is where long term investment capital has/is being parked for the time being.
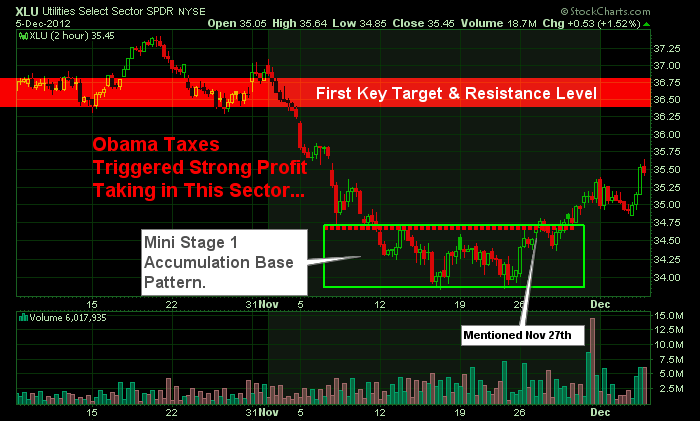
Utility Stock Sector – Deeper Look – 2 Hour Candle Chart Time Frame
Last week I covered utility stocks in detail showing you the Stage 1 – Accumulation base which they had formed. The chart below shows the recent price action on the 2 hour candle chart and recent run up. You can learn more about how to take advantage of this sector here: http://www.thegoldandoilguy.com/articles/its-the-season-to-own-utility-stocks/
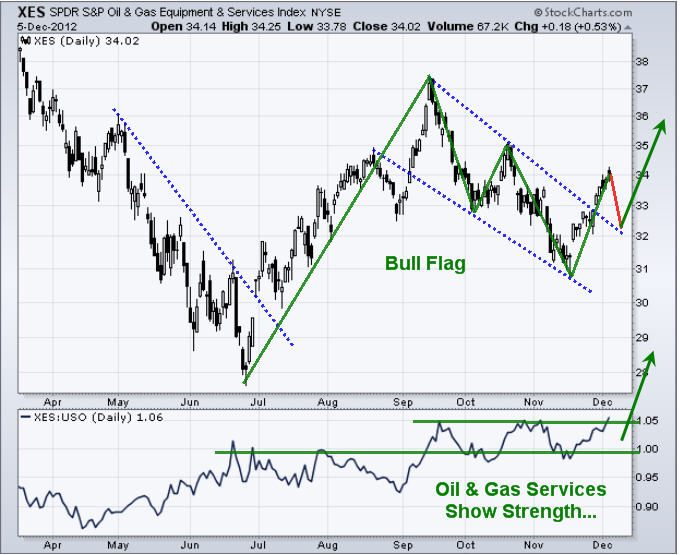
Oil and Gas Services – Daily Time Frame
This chart shows a very bullish picture for the services along with its relative strength to oil (USO) at the bottom. While the sector looks a little overbought here on the short term chart, overall it’s pointing to much higher prices.
Energy Sector Conclusion:
In short, crude oil looks to be trading in a VERY large range without any sign a breakout above or below its channel lines for several months at the minimum. But if the lower channel line is reached and oil starts to trend up then these energy related sector ETFs should post some very large gains and should not be ignored.
Get These Weekly Trade/Investment Ideas In Your Inbox FREE: www.TheGoldAndOilGuy.com
By Chris Vermeulen
Please visit my website for more information. http://www.TheGoldAndOilGuy.com
Chris Vermeulen is Founder of the popular trading site TheGoldAndOilGuy.com. There he shares his highly successful, low-risk trading method. For 7 years Chris has been a leader in teaching others to skillfully trade in gold, oil, and silver in both bull and bear markets. Subscribers to his service depend on Chris' uniquely consistent investment opportunities that carry exceptionally low risk and high return.
This article is intended solely for information purposes. The opinions are those of the author only. Please conduct further research and consult your financial advisor before making any investment/trading decision. No responsibility can be accepted for losses that may result as a consequence of trading on the basis of this analysis.
Chris Vermeulen Archive |
© 2005-2022 http://www.MarketOracle.co.uk - The Market Oracle is a FREE Daily Financial Markets Analysis & Forecasting online publication.