


Gold Should Be Nearing A Major Bottom
Commodities / Gold and Silver 2012 Dec 05, 2012 - 09:45 AM GMTBy: David_Banister

 The recent rally in Gold took the metal from the 1620’s to roughly 1800 per ounce before the ensuing corrective action began. Back around October 20th we warned our readers about a likely “ wave 2” correction in Gold and we had several reasons for that warnings. One of the biggest concerns we had was that the sentiment surveys were running very hot at the time. The percentage of professional advisors polled that were bullish on GOLD was 88%, with 7% neutral and only 7% bearish. Elliott Wave Theory is the foundation of our work, though we are sure to mix in other clues and elements to “fact check” our reads. When you see sentiment readings that high, coupled with a $180 rally leading up to those readings, you can begin to look for clues of a top.
The other warning signal we noted was the MACD signal which had crossed south and was a topping warning signal to get out of GOLD for intermediate traders. At the time, we surmised that a “wave 2” correction in sentiment, and therefore price was required to work off the overbought conditions. The first level attacked the 1681 areas roughly and then a “B” wave rally to 1751 roughly ensued. Wave 2’s are made up of a 3 wave pattern, A down- B up- and C down to finish. It appears that GOLD is now in the final C wave down in sentiment to complete the correction pattern.
Clues for the “C” wave include the Goldman Sachs quasi-bearish 2013 GOLD forecast that came out today. In addition, the media attempting to explain the drop in GOLD as being related to stronger than expected economic indicators or fiscal cliff negotiations, neither of which make any sense at all.
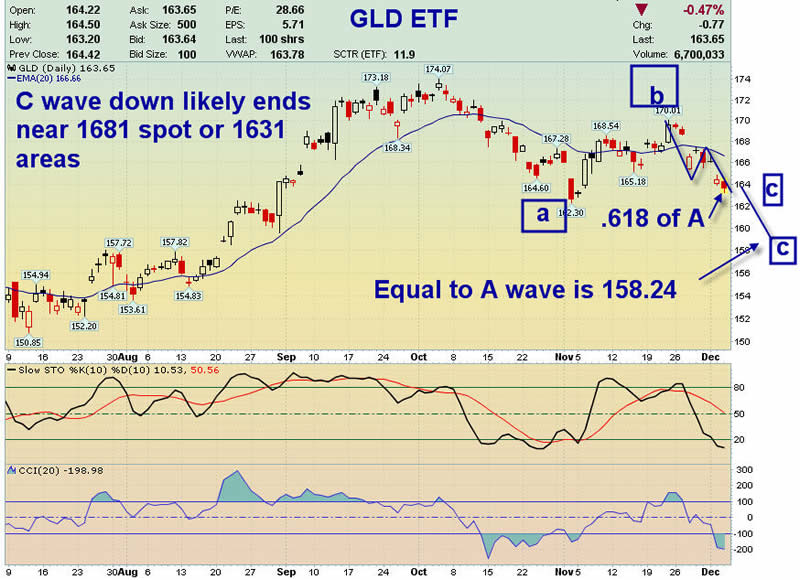
We expect GOLD therefore to complete the C wave correction at 1631 or 1681 specifically. There are Fibonacci fractal relationships to the first leg down (The A wave) at those levels, and they tend to repeat themselves in terms of crowd behavior. At the 1681 level we have the C wave equal to 61.8% of the A wave amplitude. At 1631 we have a more traditional C wave equal to the A wave. In either event, look for a washout low in GOLD occurring at anytime near term, and for traders to start scaling in long.
Below is the GLD ETF chart showing the two most likely bottoms for the precious metal, one of which already qualifies as of today’s trading:
Consider signing up for our free weekly report at www.MarketTrendForecast.com or take advantage of our 33% coupon by signing up today for SP 500 and GOLD forecasts updated on a daily basis.
Dave Banister
CIO-Founder
Active Trading Partners, LLC
www.ActiveTradingPartners.com
TheMarketTrendForecast.com
Dave Banister is the Chief Investment Strategist and commentator for ActiveTradingPartners.com. David has written numerous market forecast articles on various sites (MarketOracle.co.uk, 321Gold.com, Gold-Eagle.com, TheStreet.Com etc. ) that have proven to be extremely accurate at major junctures.
© 2012 Copyright Dave Banister- All Rights Reserved
Disclaimer: The above is a matter of opinion provided for general information purposes only and is not intended as investment advice. Information and analysis above are derived from sources and utilising methods believed to be reliable, but we cannot accept responsibility for any losses you may incur as a result of this analysis. Individuals should consult with their personal financial advisors.
© 2005-2022 http://www.MarketOracle.co.uk - The Market Oracle is a FREE Daily Financial Markets Analysis & Forecasting online publication.