How To Find Trades USing Chart Analysis - 10 Year Note And Wheat
InvestorEducation / Learn to Trade Dec 02, 2012 - 03:29 PM GMTBy: Michael_Noonan
 The one question so many want to know is where to find a good trade? From our perspective, we could care less what the underlying futures/stock is, because when reduced to charts, they are all subject to the forces of supply and demand, and they all have the same underlying factors of fear and greed.
The single-most important consideration for any potential trade is knowledge of the trend, and then the location of price within that trend. What we want to do is ferret out the story being developed and depicted in any chart. By viewing various time frames, the objective is to find a consistency and synergy amongst them, for that is what can provide an edge in making a trade. Without an edge, it is like being in a boat without any guiding system to steer clear of unseen hazards.
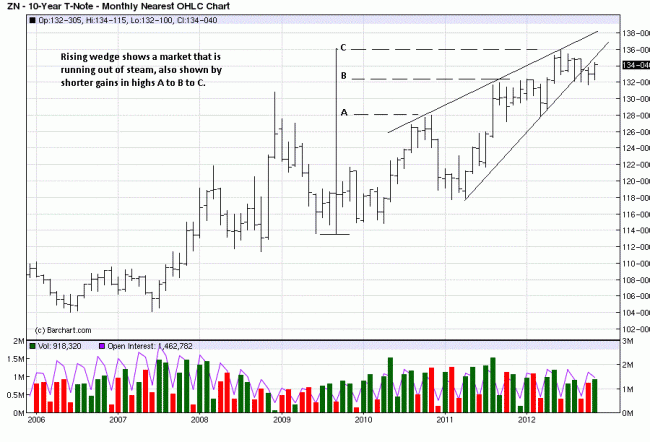
The trend on the monthly 10 Year Note remains up, but weakened, and we chose the 10 Year over the 30 Year Bond because it has much greater volume and less volatility. A weakened trend leads to a possible turn, in this case from up to sideways, before turning down. The earlier one can catch a market turn, the less is the risk factor.
The rising wedge provides some important information, not because of its geometric shape, but because it tells us that each time the market makes new highs, there are less gains from the previous swing high. The straight line up from the last important low, marked A, B, and C shows the diminishing gains from the low to swing high A; from swing high A to B, and then to C. If the market in the Ten Year is indeed weakening, it should also be evidenced in the smaller time frames, weekly and daily.
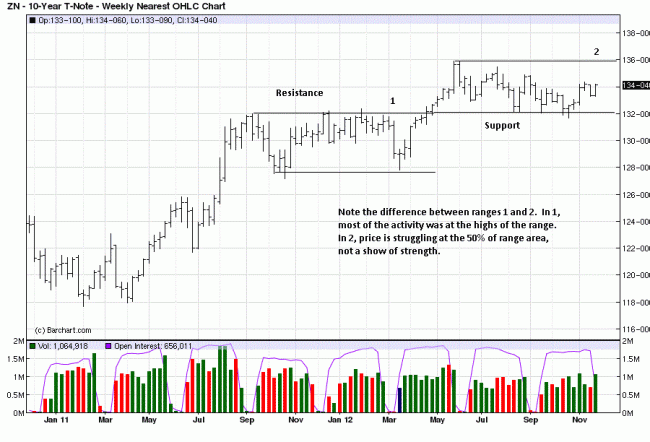
The weekly gives a totally different look not apparent on the monthly. We see two trading ranges, and while the net gain of the second range is relatively small, it is the character of each range that adds to the context of a developing story. In range 1, most of the trading activity is close to the top of the range. This is an example of absorption, where buyers are taking all the offerings of sellers. While the sellers were persistent, it was the buyers who maintained control.
Once we get to the second trading range, still in progress, it echoes the monthly observation of a weakening trend. Note how price is struggling to get above 50% of the trading range band. It was positive in range 1 when price was hugging the 132 area of resistance. In trading range 2, it is hugging 132 again, but at the bottom of the area, unable to rally away from it.
The range is still developing, without a resolve, but we are looking for a potential trade that will provide an edge, reducing risk and increasing the probability of a positive outcome. We go to the daily to see if there is a potential trade to make.
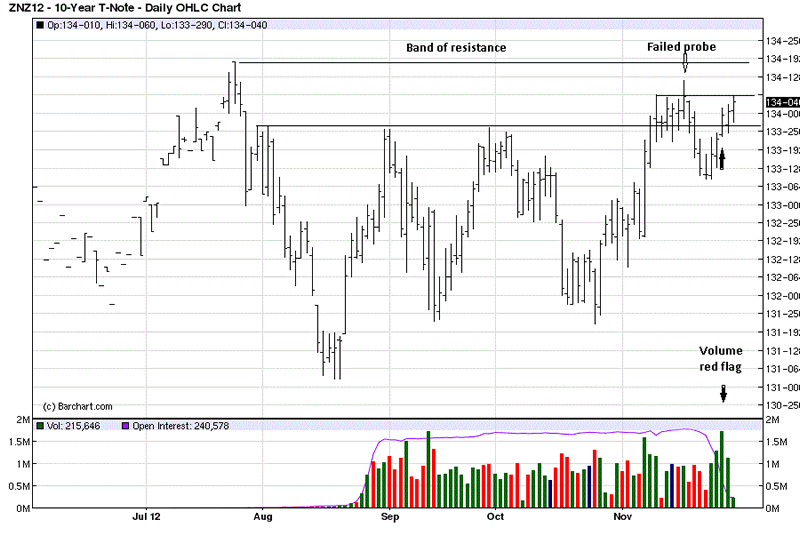
The July high and the failed swing highs of August and September provide a band of resistance. the most recent swing high has rallied into that area, but there are two signs of trouble. The first is the failed probe at the high. Price rallied above the past few days highs, but selling entered the market to push the close nearer to mid-range the bar, and just under the small resistance line.
The second sign of potential trouble was the sharp spike in volume, three trading days ago. Volume is the energy behind a price move. In this instance, the energy level was unusually high. Note the range of the bar, a little less than average over the past month, or more. What we take away from that is the likelihood that sellers were meeting the effort of buyers and preventing the range from expanding higher. If that is the case, then buyers are losing control, but it is not apparent to most of the trading participants who do not understand the dynamics between price and volume behavior. We see it as a red flag, warning of a potential reversal in price, and the observance of weakness is apparent on all three time frames, presenting what could be an excellent trade potential.
The point is to present the situation before anything happens, to demonstrate that developing market activity does advertise its intent. We do not need to predict anything. We do not even have to guess as to what the market may or may not do. With trading rules in place, we simply wait to see if there is an indication to go short at what would be best described as the danger point, allowing for a reasonable , if not small risk in a possible trade.
It is a bit ironic to call the location of a potential trade at the danger point, because risk is actually smaller than it would be when there is additional information that makes taking a short more apparent. When it does become more apparent, price will be lower, and seemingly be a more secure trade, but the risk will be higher!
What makes this exercise worth while is that it allows for planning, and it then becomes a matter of execution, IF and ONLY if other factors fall into place. If not, there will be no trade and no risk exposure.
We will come back to this at some point when a resolve is determined that will demonstrate that market activity is the best source for locating potential trades. What we like about the market is, it never lies.
To be continued… [See Wheat, below]
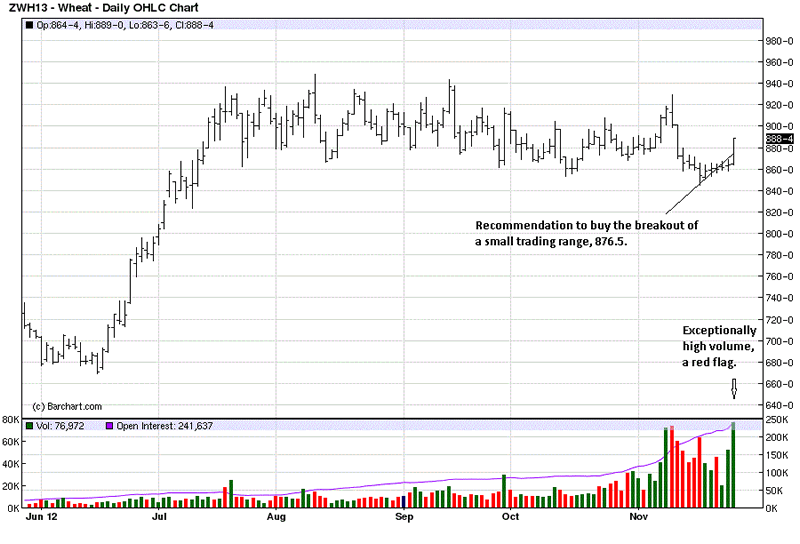
Here is how the trade was handled, for better or worse: Next chart…
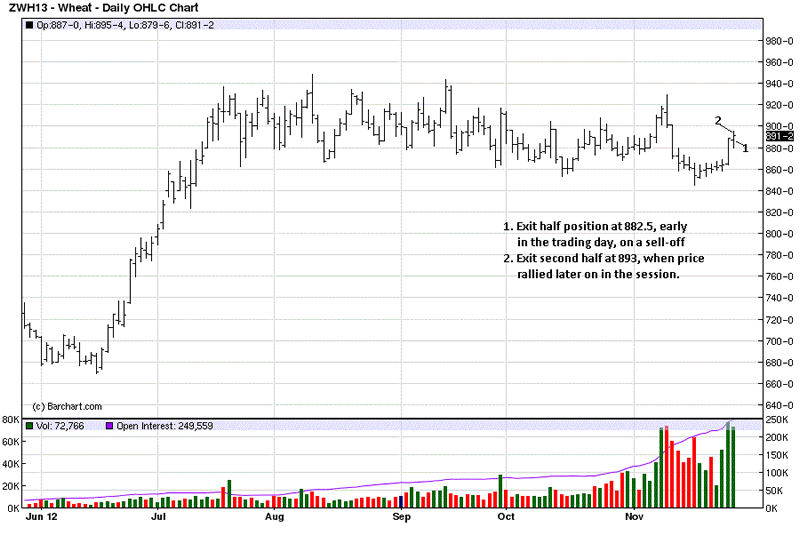
Next day, price opened and began to sell off, early. Immediately, we exited half the
position, at 882.5, and raised the stop on the balance. The first sell was near the lows
of the day, but at the time, that was an unknown. When price subsequently rallied to
the 895 area, we opted to exit the balance, at 893, with a “Thank you for the opportunity,”
thought in mind.
You can see, by the end of the day, the market was still looking positive, or so it would
seem. Yes, wheat closed higher, but note the smaller range of the bar, and then look
at the volume for that day…still running quite high, and disproportionate to the size
of the range. For all of that volume effort, why did price not go higher? For us, the
answer was that sellers were more than matching the efforts of the buyers, they had
stopped the buying effort, entirely.
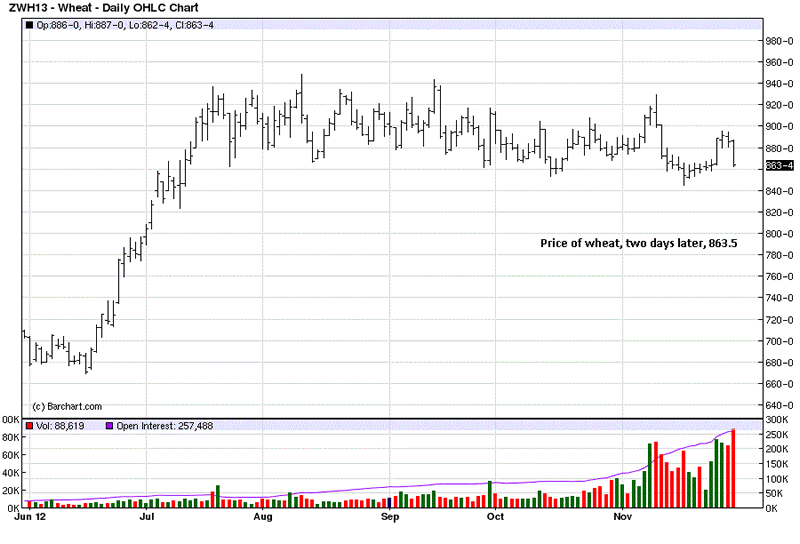
One more chart.
We always maintain that “Anything can happen,” in the markets, and there is absolutely
no way to know HOW a market will develop from one day to the next. All anyone can do
is to use the developing market activity, with its implied message, and act accordingly.
This is why we are watching the 10 year.
Michael Noonan, mn@edgetraderplus.com, is a Chicago-based trader with over 30 years in the business. His sole approach to analysis is derived from developing market pattern behavior, found in the form of Price, Volume, and Time, and it is generated from the best source possible, the market itself.
© 2012 Copyright Michael Noonan - All Rights Reserved Disclaimer: The above is a matter of opinion provided for general information purposes only and is not intended as investment advice. Information and analysis above are derived from sources and utilising methods believed to be reliable, but we cannot accept responsibility for any losses you may incur as a result of this analysis. Individuals should consult with their personal financial advisors.
Michael Noonan Archive |
© 2005-2022 http://www.MarketOracle.co.uk - The Market Oracle is a FREE Daily Financial Markets Analysis & Forecasting online publication.


