


Economic Impact of Super-Storm Sandy and the Electoral Blues Update
Economics / US Economy Nov 27, 2012 - 06:22 AM GMTBy: CMI

 Earlier this month we reviewed the impact of Hurricane Sandy and the presidential election on the shopping behavior of American consumers by comparing this year's behavior with what we had observed during the 2008 election campaign. In both cases we witnessed a significant fall-off in consumer demand that was broadly coincidental with the election:
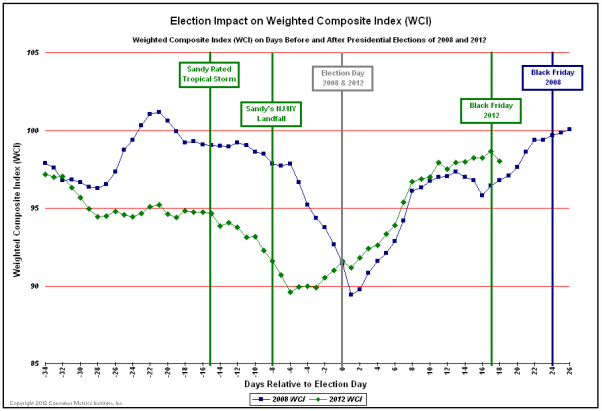
Obviously the comparison is admittedly a little messier than we might have wished, because in 2012 we were experiencing two nearly simultaneous events (Sandy and the election) that could have had a significant impact on consumer activity. That said, the above chart is interesting on a number of levels:
-- On-line consumer demand for discretionary durable goods in 2012 was substantially worse (on a year-over-year basis) than 2008 heading into the weeks prior to the general election -- even though the 2008 election occurred during the very heart of the "Great Recession." The far left part of the above chart pre-dates any plausible impact from Sandy, which was not even rated as a "tropical storm" until October 22nd (Day -15 relative to the election). This decline in consumer demand was hardly unexpected, since the pre-election rhetoric and campaign advertising had given consumers very little reason to feel good about the health of the economy (or their personal income/employment/wealth prospects for the immediate future). Chalk up at least a portion of the year-over-year decline to collateral damage from a very nasty campaign.
-- The chart indicates that the economic distractions of Sandy commenced several days prior to landfall as storm related preparations displaced normal commerce for as many as 10 million households.
-- Post-landfall on-line consumer demand did not return to pre-landfall levels for 10 days. Perhaps as much as 5% of US consumers were without power for several days, meaning that even those fortunate enough to avoid catastrophic property losses were experiencing material interruptions in their normal day-to-day activities.
-- Superimposed upon the decline caused by the storm is the nation-wide impact of the election. Although the lowest readings in 2012 were clearly in the immediate wake of the storm, the post-election pattern of consumer demand in 2012 was strikingly similar to (albeit slightly higher than) the pattern from 2008 -- even including a brief post-election hangover.
-- The post-election behavior of consumers also benefited from the relative proximity of the "Black Friday" kick-off to the holiday shopping season. In 2012 that kick-off occurred at the earliest possible calendar date, whereas in 2008 the same kick-off occurred at nearly the latest possible date. In the above chart the 2012 "Black Friday" level of our Weighted Composite Index ('Weighted Composite Index') can be seen to be a couple of points below the level reached by "Black Friday" in 2008 -- again arguably in the midst of the "Great Recession."
The impact of all of the above on the 4Q-2012 GDP remains to be seen, but it likely does not bode well. So far during the current quarter we are recording real-time year-over-year consumer demand for discretionary durable goods (some 14% of total consumer spending) at an average of about 5% below year earlier levels. And during that year earlier period (4Q-2011) the BEA recorded annualized growth of the "real final sales of domestic product" at a very modest 1.57%. All else being equal, we might expect that the consumer's contribution to the anemic "real final sales" growth rate from a year ago will be halved during 4Q-2012.
Consumer Metrics InstituteTM
Home of Daily Consumer Leading Indicators
http://www.consumerindexes.com
© 2012 Copyright Consumer Metrics Institute - All Rights Reserved Disclaimer: The above is a matter of opinion provided for general information purposes only and is not intended as investment advice. Information and analysis above are derived from sources and utilising methods believed to be reliable, but we cannot accept responsibility for any losses you may incur as a result of this analysis. Individuals should consult with their personal financial advisors.
Consumer Metrics Institute Archive |
© 2005-2022 http://www.MarketOracle.co.uk - The Market Oracle is a FREE Daily Financial Markets Analysis & Forecasting online publication.