


Age Of Illusionists, Focus on Government Spending and Money Supply
Economics / Money Supply Nov 27, 2012 - 03:51 AM GMTBy: Steve_H_Hanke

 Watching Barack Obama and Mitt Romney duel in the presidential campaign should have convinced the spectators that we live in an age of illusionists. Few of the assertions and conjectures thrown around have been subjected to what the political chattering classes deem to be the indignity of factual verification.
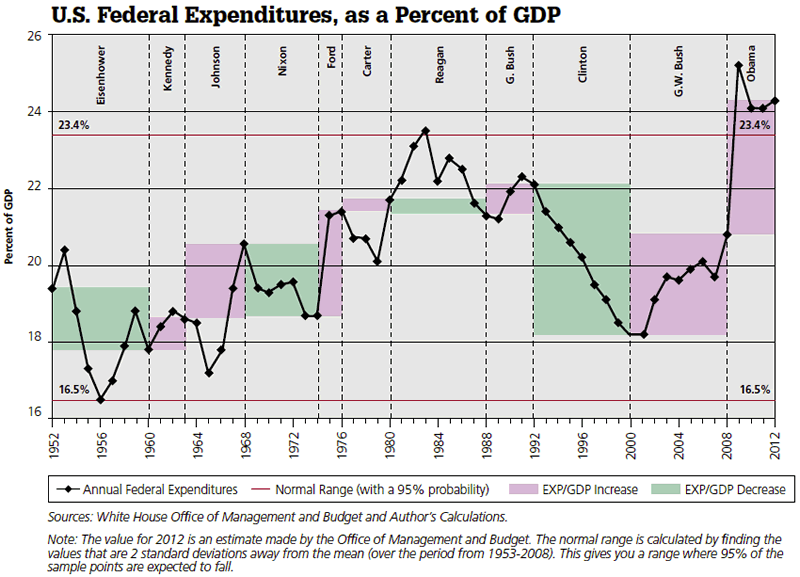
As a point of departure from illusion to factual reality, I present the accompanying chart, which traces the evolution of federal government expenditures, as a percent of GDP, since 1952. Based on the data, from 1952 until 2008 – when President Obama was first elected – we would expect, with an assurance of 95%, that the relative size of the federal government would fall in a range of 16.5% to 23.4% (see the accompanying chart). Since President Obama’s election, in 2008, the federal government has been in uncharted territory. Today, for example, federal government expenditures, as a percent of GDP, register at 24.3%. This is nine tenths of a percentage point higher than the high end (23.4%) of the so-called 95% historical range. For many people and businesses, this unusually elevated level of government spending is a source of uncertainty and anxiety.
Before proceeding, another inconvenient little fact must be mentioned. The economic cost of a dollar’s worth of government expenditures is more than a dollar, because taxes must be imposed to finance government expenditures. These taxes impose distortions (costs) on the economy, and these distortions cut the economy’s potential and reduce economic productivity. The costs created by taxes are referred to as the “excess burden” of taxation.
Since 1992, even the White House Office of Management and Budget (OMB) has recognized the existence of the excess burden. For purposes of evaluating federal projects, the OMB requires that an excess burden of 20% be employed. A wide range of scholarly research indicates that the average excess burden of the federal tax system is actually closer to 35%. Accordingly, the real economic cost of a dollar’s worth of federal spending is $1.35, not $1.00. To put this fact into context requires us to expand the level of government expenditures by 35%. After we do that, federal government expenditures, as a percent of GDP (including the excess burden of taxes), rise from their current level of 24.3% to a whopping 32.8%. By adding this little inconvenient fact into the mix, the “big” versus “small” government debate comes into sharper relief.
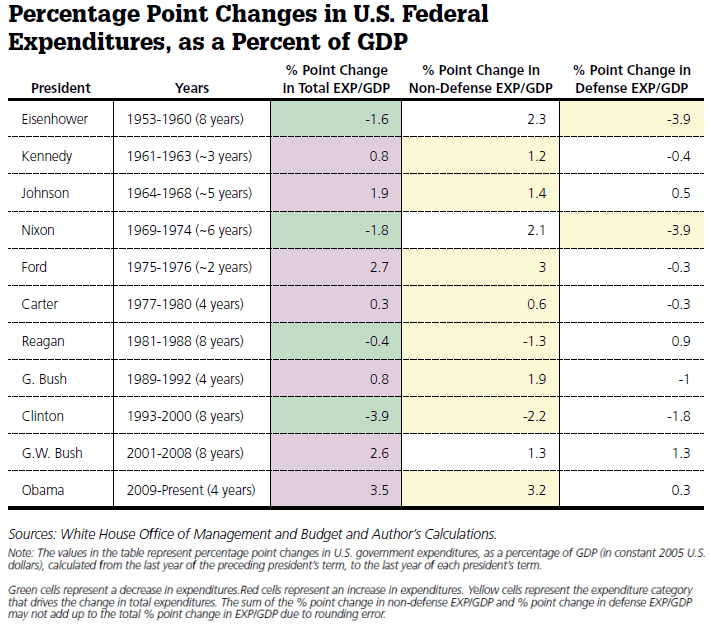
The accompanying table allows for a more precise look at the fiscal record of U.S. Presidents. Let us begin with President Bill Clinton. The Clinton presidency was marked by the most dramatic decline in the federal government’s share of the U.S. economy since Harry Truman left office. The Clinton administration reduced the relative size of government by 3.9 percentage points. Since 1952, no other president has even come close. At the end of his second term, President Clinton’s big squeeze left the size of government, as a percent of GDP, at 18.2%.
What is noteworthy is that the squeeze was not only in defense spending, but also in non-defense expenditures. Indeed, the non-defense squeeze accounted for 2.2 percentage points of President Clinton’s 3.9 total percentage point reduction in the relative size of the federal government. Since 1952, the only other President who has been able to reduce non-defense expenditures was Ronald Reagan.
The Clinton squeeze didn’t last long, however. By President George W. Bush’s second year in office, the federal government’s expenditures (both defense and non-defense) were exploding. By the time he left office, his administration had added a whopping 2.6 percentage points (equally split between defense and non-defense expenditures) to the federal government’s share of the economy.
With President Obama, the size and scope of the federal government has expanded at an accelerating rate. In his first four years, President Obama has operated in the twilight zone, with government expenditures, as a percent of GDP, exceeding the top of the 95% historical range in each year of his first term. In just four years, President Obama’s administration has added a record 3.5 percentage points to the federal government’s share of the economy. It took George W. Bush eight years to reach what was then a near-record increase (2.6 percentage points). The astounding thing about this brief account of the evolution of the relative size of the federal government is President Clinton’s change of mind. During his presidency, Clinton squeezed and squeezed hard, and his rhetoric matched his actions. Recall that in his 1996 State of the Union address, he declared that “the era of big government is over.”
By contrast, the champion of “big government” – in both rhetoric and deeds – is President Obama. And who was a champion of the President’s reelection? None other than President Clinton – the illusionist?
This brings us to the sharp pencil people in the Obama administration, specifically the OMB. They claim to know what the relative size of the federal government will be in 2016, at the end of President Obama’s term. According to the OMB’s plans, the federal government, as a percent of GDP should be 22.5%. That’s a 1.8 percentage point drop from the current level. Given that President Obama’s first term recorded a record growth in the relative size of the federal government, and that the President campaigned on a platform of more big government, it is doubtful that he will come close to meeting his own OMB forecasts, in his second term. Yes, the illusionists, not the President’s sharp pencil people, will probably carry the day.
What will make the President’s task even more onerous is money – as in the money supply. It turns out that the Obama administration, led by U.S. Treasury Secretary Timothy Geithner, has embraced the imposition of more stringent capital requirements on banks. And, the Obama administration isn’t alone. All the major powers have backed the use of Basel III bank capital requirements. These elevated bank capitalization mandates, when applied in the middle of a slump, are misguided and dangerous.
They have forced banks to deleverage on a massive scale. In consequence, bank money (the portion of the money supply created by the banking system) has contracted in most countries. And, since this portion of the money supply is so much larger than that accounted for by state money (the portion of the money supply produced by central banks), the net result has been a tight monetary reality in most countries – with a few exceptions, such as Canada, Germany, and several Asian countries. This explains why we are witnessing so many credit crunches at the same time central banks are pouring out liquidity.
The Obama administration (and the Bernanke-led Federal Reserve) isn’t the first to be caught wrong-footed by the embrace of more stringent bank capital requirements. In 1988, Basel I was approved. It had been supported by President George H.W. Bush and then-chairman of the Fed Alan Greenspan. As the accompanying chart shows, the money supply growth rate slowed sharply in anticipation of the more stringent capital requirements, as banks reined in loan growth.
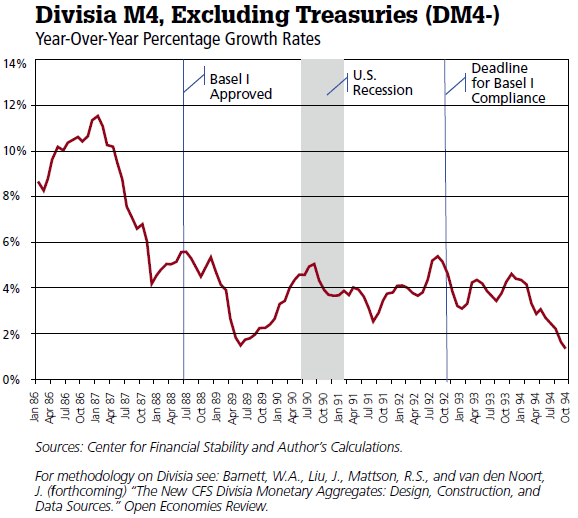
The result was a mild recession; one that cost H.W. Bush a second term. In the case of both Basel I and Basel III, the illusion of “safer banks” ultimately weakened the economy and made the banks less safe.
Back to Basel III and President Obama’s money supply woes. As the accompanying chart shows, the Fed has dramatically increased the supply of state money (Monetary Base) since the fall of 2008, when Lehman Brothers collapsed.
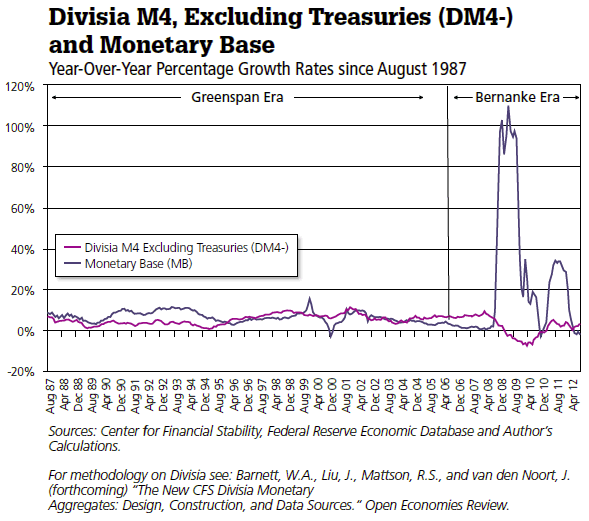
But, state money only makes up roughly 15% of the total U.S. money supply. Bank money is the elephant in the room, and due to the anticipation of more stringent capital requirements (Basel III), bank money has been contracting. In consequence, the total money supply (Divisia M4, excluding treasuries) has slumped.
Since money dominates, the economy has failed to ever recover to its trend rate of growth. A U.S. growth recession – growth, but below the trend rate – at best, will make it very difficult to push government expenditures, as a percent of GDP, down into the normal range, let alone reach the fanciful OMB target of 22.5% by 2016. It would seem that the President’s promises of future cuts are nothing more than an election-year illusion.
Thanks to Basel III, the U.S. money supply isn’t the only one creating growth headwinds. Europe faces significant money supply deficiencies (see the accompanying table).
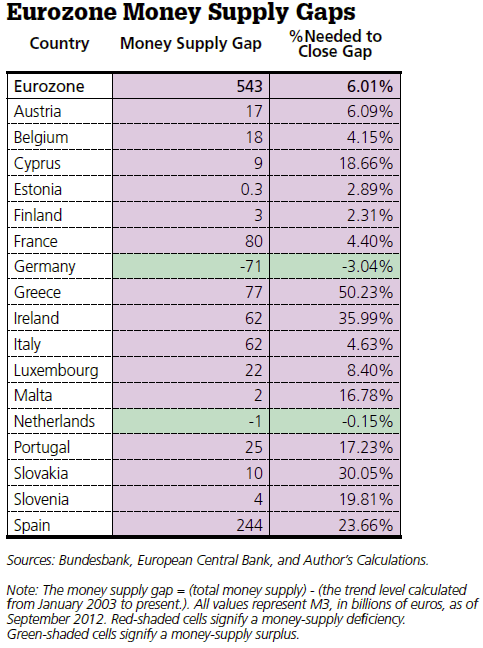
It’s no surprise that the Eurozone has just fallen into a recession. When it comes to the money supply, just about the only bright spots are in Asia (see the accompanying table).
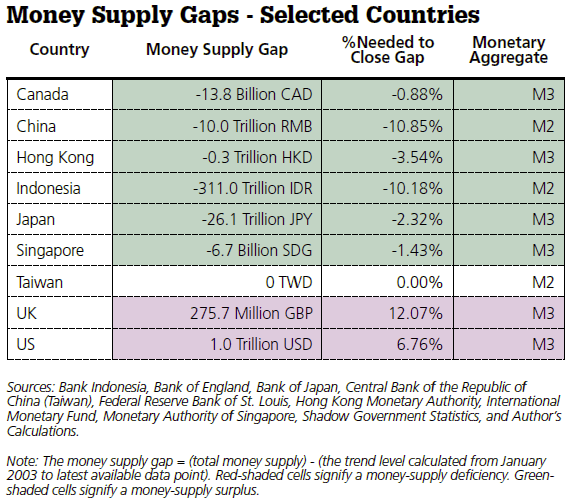
Will Asia continue to be the world’s locomotive? We will have to wait and see. At present, though, one thing is certain – an age of illusionists has arrived.
Authored by Steve Hanke, originally published at GlobeASIA,
By Steve H. Hanke
www.cato.org/people/hanke.html
Steve H. Hanke is a Professor of Applied Economics and Co-Director of the Institute for Applied Economics, Global Health, and the Study of Business Enterprise at The Johns Hopkins University in Baltimore. Prof. Hanke is also a Senior Fellow at the Cato Institute in Washington, D.C.; a Distinguished Professor at the Universitas Pelita Harapan in Jakarta, Indonesia; a Senior Advisor at the Renmin University of China’s International Monetary Research Institute in Beijing; a Special Counselor to the Center for Financial Stability in New York; a member of the National Bank of Kuwait’s International Advisory Board (chaired by Sir John Major); a member of the Financial Advisory Council of the United Arab Emirates; and a contributing editor at Globe Asia Magazine.
Copyright © 2012 Steve H. Hanke - All Rights Reserved
Disclaimer: The above is a matter of opinion provided for general information purposes only and is not intended as investment advice. Information and analysis above are derived from sources and utilising methods believed to be reliable, but we cannot accept responsibility for any losses you may incur as a result of this analysis. Individuals should consult with their personal financial advisors.
|
© 2005-2022 http://www.MarketOracle.co.uk - The Market Oracle is a FREE Daily Financial Markets Analysis & Forecasting online publication.