


Economic Deception At The Heart Of The U.S. Fiscal Cliff
Economics / Government Spending Nov 27, 2012 - 03:23 AM GMTBy: Dan_Amerman

 Truth Testing The Narrative
Among many politicians and much of the media there is an accepted narrative about deficits, taxes and the so-called "Fiscal Cliff". It goes something like the following:
"The United States is running massive deficits that are bankrupting the country. These deficits are so high because of the Bush era tax cuts.
So if we just end the tax cuts that caused this deficit in the first place, and make the rich return to paying their fair share of taxes, then much of the deficit problem is solved."
For millions of people in this country this is a compelling narrative, and understandably so. Because if we're so heavily into debt because of tax cuts that were given to the privileged, we need to just end the tax cuts and then the downward spiral ends -- which seems fair enough.
There's only one problem with this narrative – it isn't true.
To uncover the hidden truth about the Fiscal Cliff we're going to explore seven layers of the trillion dollar a year sleight of hand which hides the real US economy, and is the actual source of the deficits.
For the first time, we'll examine the hidden "math trap" that the private sector has fallen into when it comes to supporting the public sector, and the extraordinary implications for all of us, particularly long-term stock investors.
Based on the math trap, we will show the staggering 40% increase in tax rates that would be needed to return the budget to 2007 levels, if this is to be done without reducing government spending.
Even in the unlikely event that the current Fiscal Cliff tax increases go through in full, those would cover only half of what is needed to pay for the transformed relationship between private and public sectors that was confirmed in the 2012 elections. Once we understand that, then the true nature of the Fiscal Cliff becomes clear: it is but the first step in an ongoing process, and the government will be coming back, again and again, in what may dominate the economy, investment returns and individual standards of living for decades to come.
Fiscal Cliff Overview
According to the Congressional Budget Office (CBO) and the White House, the Fiscal Cliff has three components for the next year:
1) A $112 billion cut in discretionary spending that will include ending extended unemployment benefits, cuts in the Defense department, and reducing Medicare payment rates for doctors, among other types of discretionary spending.
2) A $399 billion increase in tax revenues; and
3) Another somewhat obscure $105 billion in mostly projected "revenues" that result from economic growth.
The CBO is therefore projecting about $4.5 dollars in new revenues (increased taxes), for every $1 in spending cuts. Given that item #3 is pure guesswork on the CBO's part, we'll just examine the two straight-forward deficit reduction components. These total about $511 billion out of what the CBO estimates would otherwise be a $1.2 trillion deficit for fiscal year 2013. This is a massive reduction in the deficit – even if despite these draconian measures, most of the annual deficit remains outstanding.
Now among the most puzzling parts about the narrative and the spin surrounding the Fiscal Cliff is that the reduction in spending is sometimes referred to as the lead part of the story, and the tax increase is sort of the footnote that follows it.
The reality is, however, that what the Fiscal Cliff package is all about is a 3% reduction in spending and a 20% increase in individual tax revenues. In other words, it is actually primarily about a massive tax increase rather than a significant cut in overall spending. According to an October 2012 analysis by the Urban Institute and Urban-Brookings Tax Policy Center, the average tax increase per household would amount to $3,500, with the average middle class household seeing about a $2,000 increase.
Layer One: The Placid & Deeply Misleading Surface
The official version regarding the US economy is that there was a short recession that accompanied the Financial Crisis of the 2008. That between 2007 and 2009, the US Gross Domestic Product fell by 2%, and the recession ended in June of 2009. And since that time the US GDP has rebounded to over $15 trillion, and the nation has never been wealthier.
Now there are many among the public that don't entirely accept this version; in fact opinion polls show that a majority of the American people believe that the economy is in worse shape than the government says it is. And indeed, we only need to look at the term "Great Recession" to see the doublespeak and understand that the government and establishment are not being truthful about the economy.
That is, while the official numbers assert that a relatively brief recession ended in June of 2009, and that the US economy has never been larger than it is right now, there is simultaneously a quite open acknowledgement of the "Great Recession". Both obviously can't be true at the same time; either a short and not particularly deep recession ended long ago, or there is a severe recession that is still ongoing.
This conflict is the result of the common but overly simplistic approach of boiling the entire economy down to one number -- that of total GDP -- and gauging the economic health of the nation based on that one number. But if we go down just one layer beneath that single number, the conflict disappears - as does the recovery.
Layer Two: The Trillion Dollar Swap
The central problem with the US economy is that a big chunk of it effectively collapsed between 2007 and 2009, and despite claims to the contrary, it has not since recovered. Consider the graph below:
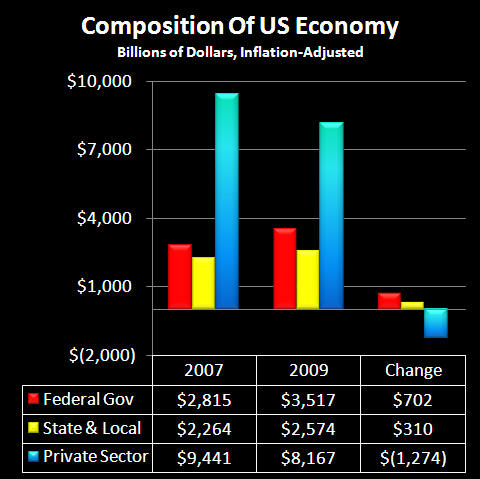
The private sector within the economy plunged by $1.3 trillion per year. The devastating effects of this collapse were, however, immediately covered over by the government ramping up its spending by $1 trillion per year (between state, local and federal governments).
So one could say that an economic sleight of hand was deployed. When the private sector fell by $1.3 trillion, the public sector simultaneously and on an unprecedented basis jumped by $1 trillion, thus fundamentally changing the composition of the US economy. However, when we look at the surface level of the economy as a whole - which is what the economic growth statistics and newspaper headlines are based upon - there is no way of seeing what actually happened. Instead, it appears as if the economy shrank by "only" $300 billion.
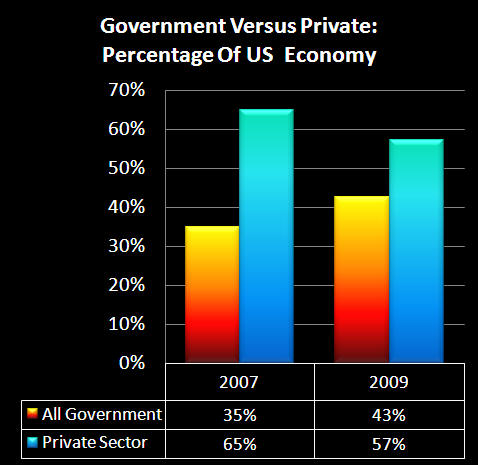
In an economic heartbeat, we jumped from the government consuming 35% of the US economy to the government consuming 43% of the US economy. Three years later at the end of 2012, the situation remains the same, with government spending still stuck at an extraordinary 43% of the US economy.
So when we look at the illusion of economic recovery, we see that it is dependent on the inability to distinguish between the government's spending money versus a private economy creating jobs and real wealth.
There are serious issues with this sleight of hand, one of them being that the government didn't and doesn't have the money to pay for the sudden surge in spending required for the public sector to go from 35% of the economy to 43% of the economy.
The private sector of course generates the taxes that pay for the public sector. So when we do a substitution of public for private on a trillion dollar scale -- even if the superficial picture that is presented does effectively deceive the public -- when it comes to taxes, the damage can't be concealed indefinitely. The loss of $1.3 trillion dollars of healthy, tax-producing wealth and jobs necessarily pulls down tax revenues, even as government spending instantaneously soars by $1 trillion per year.
Layer Three: A 28% Reduction
Now it would be easy to miss just how devastating this under-the-surface swap of private for public GDP was when it comes to the economy and tax revenues. One might think, "just 8% of the economy swapped, and that is less than 10%, which may not be good, but it's not that huge a deal, right?"
Wrong. What makes it a huge deal is that the two happened simultaneously. When the private sector started at $9,441 billion in 2007 and fell to $8,167 billion in 2009, that was a decline not just of 8% of the total economy, but of 13% of the private sector. And when the public portion of the economy rose from $5,079 billion to 6,091 billion in two years, that was an increase of 20% in public spending.
If we think about this like we would our household, and the wealth coming in drops by 13% at the exact same time that the expenses going out increase by 20%, then we have a much bigger problem than any of the individual numbers of 8%, 13% or 20%.
A single number that captures the bigger picture is to compare the ratio of the wealth being created by the private sector to the wealth being spent by the public sector.
When we divide $65 in private sector dollars in 2007 available (wealth coming in) to support every $35 in public spending (wealth going out), the ratio was $1.86 in private sector dollars available to support every $1 in government spending.
But beginning in 2009 through 2012, there were only $57 in private sector dollars to support a higher $43 in government spending, meaning the ratio of the private-public sectors fell to $1.33 to $1.
That is a 28% decline in private wealth creation available to support each dollar of government spending. This is really not looking good, but unfortunately, we need to take it one level further.
Layer Four: The Math Trap That Consumes Taxpayers & The Markets
The second half of the article takes a look at the Math Trap the US private economy has fallen into, why the Fiscal Cliff is a process rather than a one-time change in tax rates, the crucial relevant information to be found in the 2012 US election results, and the implications for investors.
Daniel R. Amerman, CFA
Website: http://danielamerman.com/
E-mail: mail@the-great-retirement-experiment.com
Daniel R. Amerman, Chartered Financial Analyst with MBA and BSBA degrees in finance, is a former investment banker who developed sophisticated new financial products for institutional investors (in the 1980s), and was the author of McGraw-Hill's lead reference book on mortgage derivatives in the mid-1990s. An outspoken critic of the conventional wisdom about long-term investing and retirement planning, Mr. Amerman has spent more than a decade creating a radically different set of individual investor solutions designed to prosper in an environment of economic turmoil, broken government promises, repressive government taxation and collapsing conventional retirement portfolios
© 2012 Copyright Dan Amerman - All Rights Reserved
Disclaimer: This article contains the ideas and opinions of the author. It is a conceptual exploration of financial and general economic principles. As with any financial discussion of the future, there cannot be any absolute certainty. What this article does not contain is specific investment, legal, tax or any other form of professional advice. If specific advice is needed, it should be sought from an appropriate professional. Any liability, responsibility or warranty for the results of the application of principles contained in the article, website, readings, videos, DVDs, books and related materials, either directly or indirectly, are expressly disclaimed by the author.
© 2005-2022 http://www.MarketOracle.co.uk - The Market Oracle is a FREE Daily Financial Markets Analysis & Forecasting online publication.