Why the Stock Market and Gold Rallied on Bad News
Stock-Markets / Stock Markets 2012 Nov 25, 2012 - 05:26 PM GMTBy: J_W_Jones
 The amount of negative news that we have seen recently has been mind-blowing. Europe is going into recession, Greece and several other countries are on the verge of bankruptcy, the Middle East is a powder-keg, and the U.S. is facing a fiscal cliff. Shockingly for most retail traders, the past week has produced a very strong return for U.S. equity indexes as well as risk assets in general.
Retail investors often times consistently lose money because they focus on the financial media and all of the negative news that is out there. Trust me, as a longer term trader and investor, there is never an absence of negative news or potentially poor economic possibilities. This is not to say that markets cannot decline, investors just need to understand that markets are cyclical in nature and do not ever move in a straight line.
Based on what I was reading from most of the financial blogosphere recently, you would think that the entire world was about to end. A few blogs were calling for an all out collapse late last week or a possible crash this past Monday, November 19th. As is typically the case, the market prognosticators were wrong with the calls for a crash or an absolute collapse in financial markets.
Unlike those blogs, members of my service at TradersVideoPlaybook.com were getting information indicating that we were expecting higher prices. At our service, we lay out regular videos covering a variety of underlying assets from the S&P 500 Index and oil futures, to gold and treasury futures. The focus is purely on analysis of various underlying assets across multiple time frames. We cover intraday time frames as well as daily and weekly swing time frames throughout the week with videos and written updates.
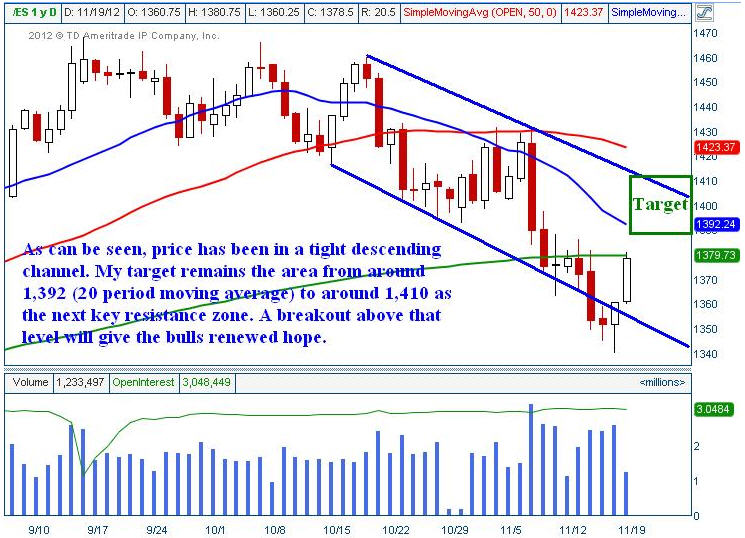
To put into perspective what we were seeing in the marketplace on Monday November 19th, the following chart was sent out to our members during intraday trading that day.

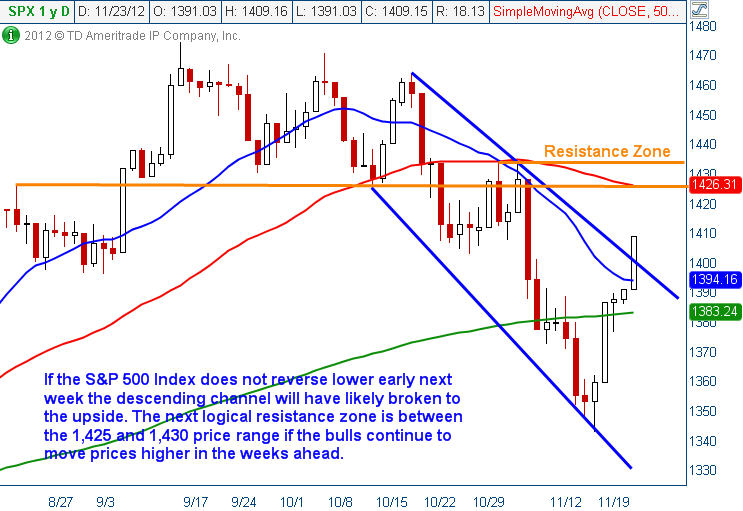
As can be seen above, the target we were expecting was at the top of the recent channel. As shown directly on the chart above was my comments that if the 1,410 level on the S&P 500 Index could be taken out to the upside, the bulls would have an opportunity to move prices higher into the end of the year. The daily chart of the S&P 500 Index after the close on Friday November 23.

As can be seen above, the S&P 500 Index moved right into the expected target price range and closed literally at the very top end of the range shown above. If prices move considerably higher, the bulls will have broken the descending channel and higher prices will likely await.
Next week’s price action is going to have a dramatic impact on the price direction of the broader market indexes. One important aspect that I would point out to readers is that the large move higher shown above came on exceptionally light volume due to the holiday week. In light of that, a strong reversal cannot be ruled out. Caution is warranted regardless of a trader or investor’s directional bias.
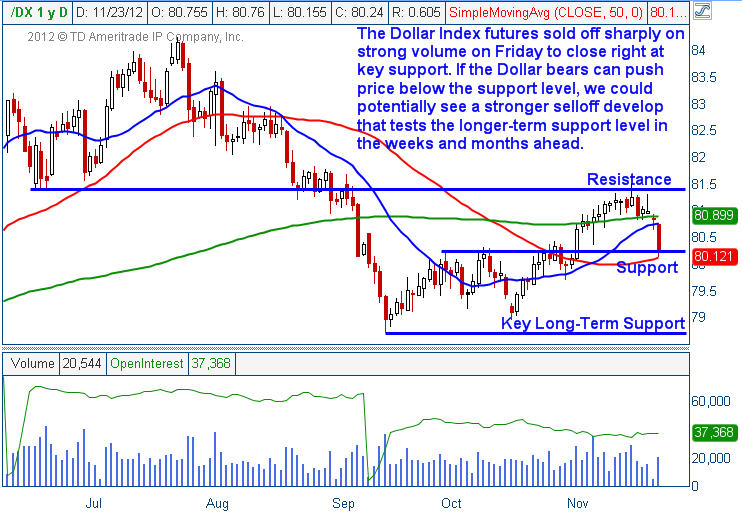
One of the most important charts to monitor over the past few weeks has been the U.S. Dollar Index futures. Typically a stronger Dollar has been bearish for equities and risk assets in general. However, on Friday we saw a very strong selloff in the U.S. Dollar Index futures as shown below.

As can be seen above, the U.S. Dollar Index futures closed on Friday right at a key support level having given back much of the recent gains. If the Dollar continues to move lower it should put a floor under stock indexes and push risk assets higher overall.
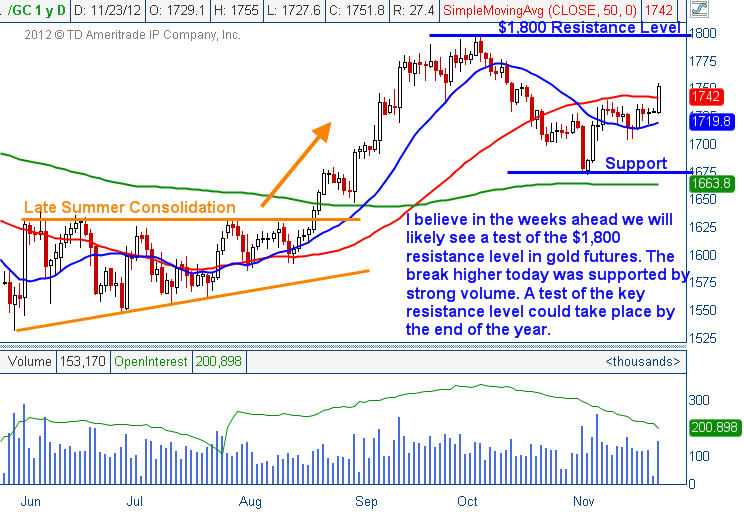
Two major moves higher occurred in light of this weakening Dollar on Friday in both gold and silver futures. The precious metals had a very strong move higher after the U.S. Presidential election and have been consolidating now for a few weeks. Prices in both gold and silver had strong moves higher on Friday which were accompanied by very strong volume. The daily chart of gold futures is shown below.

Gold futures had a huge move higher today supported by strong volume. Based on today’s action, I believe that we will see the $1,800 / ounce resistance level tested in the near term. Seasonally speaking, this time of the year is bullish for gold and silver and should the strong seasonality correspond with a weak U.S. Dollar much higher prices likely await in the precious metals sector.
Members of TradersVideoPlaybook were made aware that I was expecting very strong action in both gold and silver when they broke higher after nearly testing their 200 period moving averages. At the time, I told members that as long as the breakout from the consolidation zone from the July – August time frame held as support, higher prices were likely and that is just what we have seen.
Overall, I believe that the quarters ahead should be strong for both gold and silver. Time will tell whether oil futures and the broader equity markets will also move higher. I continue to believe that monitoring the Dollar Index futures closely is an important part of assessing the directional bias to expect in the months ahead.
We have a lot of negative news in the headlines, but Mr. Market has fooled most investors and traders alike the past week. If you were one of those investors that were fooled, consider taking advantage of our weekend special by clicking the link below: Take care and Happy Trading!
Risk-FREE 30-Day Trial
only $1 for the first 30 days!
JW Jones
www.TradersVideoPlaybook.com
J.W. Jones is an independent options trader using multiple forms of analysis to guide his option trading strategies. Jones has an extensive background in portfolio analysis and analytics as well as risk analysis. J.W. strives to reach traders that are missing opportunities trading options and commits to writing content which is not only educational, but entertaining as well. Regular readers will develop the knowledge and skills to trade options competently over time. Jones focuses on writing spreads in situations where risk is clearly defined and high potential returns can be realized.
This article is intended solely for information purposes. The opinions are those of the author only. Please conduct further research and consult your financial advisor before making any investment/trading decision. No responsibility can be accepted for losses that may result as a consequence of trading on the basis of this analysis.
© 2005-2022 http://www.MarketOracle.co.uk - The Market Oracle is a FREE Daily Financial Markets Analysis & Forecasting online publication.


