


How to Get a Consensus Before Placing a Trade
/ Learn to Trade Nov 21, 2012 - 09:12 AM GMTBy: EWI

 If you've ever considered a major medical procedure, you likely know the importance of a second opinion. Even if your doctor or specialist is experienced and strongly recommends a certain course of action, it's still risky to make a critical health decision based on one person's view.
Likewise in trading: One solitary piece of technical evidence rarely provides enough information to make a trading decision. According to Elliott Wave Junctures editor Jeffrey Kennedy, it is best to get a second (or third, or fourth) opinion from supporting indicators before you commit to a trade.
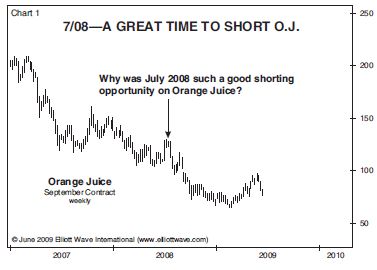
In Orange Juice, July 2008 was a good shorting opportunity not merely for one reason, but because four pieces of evidence showed that lower prices were ahead.
To illustrate my point, let's examine some price charts of Orange Juice and look at the reasons why the consensus of evidence in Orange Juice in July 2008 argued for lower prices (Chart 1).
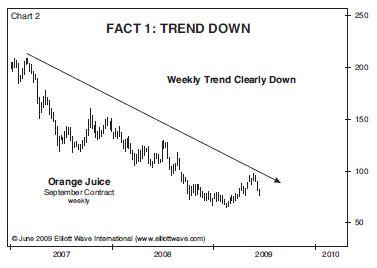
The first piece of evidence is glaringly obvious in Chart 2: the weekly trend is down:
Why is this important? Because a cornerstone belief of technical analysis is that trends persist. With the weekly trend down in O.J., odds favored more of the same in the weeks to come.
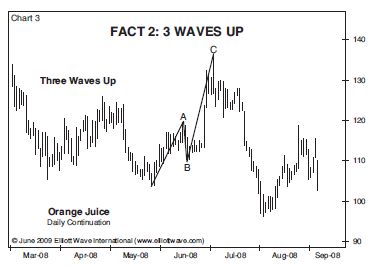
Chart 3 illustrates another piece of evidence: that the May-July advance in Orange Juice (basis the September 2008 contract) consisted of three waves.
Three-wave moves are important to Elliotticians because they are corrective wave patterns (i.e., countertrend moves).
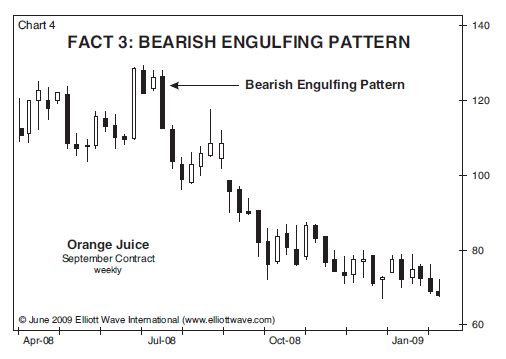
A Bearish Engulfing pattern is evident in Chart 4, which also argued for lower prices in Orange Juice. It is a Japanese Candlestick pattern in which the distance between the open and close of the current price bar encapsulates the distance between the open and close of the prior bar. More important, the close of the current bar is below the open, and the close of the prior bar is above its open:
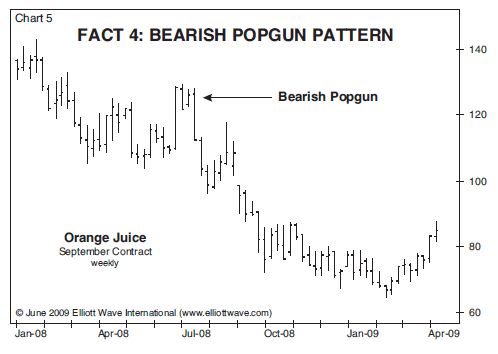
The final piece of evidence is illustrated below in Chart 5, which displays a bearish Popgun pattern:
A Popgun is a simple two-bar pattern that I have written about before... It typically forms at turning points and is composed of an outside bar that is preceded by an inside bar, similar to the Engulfing Candlestick pattern
With a strong downward trend and three additional supporting technical indicators, Jeffrey knew that he had a good opportunity to short Orange Juice. He had not just a "second opinion," but a third and fourth argument to strongly support his trading decision.
Jeffrey often says that market analysis and trading have taught him "a lot about life, and vice versa."
Just as one doctor's opinion may not be sufficient evidence to undergo the knife, a bearish wave count alone or a simple divergence in two indicators is probably not enough to raise your confidence level sufficiently to place a trade.
Learn to Apply Some of the Most Powerful Technical Methods to Your Trading Get more lessons like this in a FREE 10-lesson video series from Elliott Wave International. Jeffrey Kennedy will show you how to incorporate technical methods into your trading to help you spot high-confidence trade setups. You'll learn the methods the professional traders use, like Elliott waves, MACD, RSI, candlestick patterns, Fibonacci and more! |

This article was syndicated by Elliott Wave International and was originally published under the headline Get a Second Opinion on Your Trades with a 5-Chart Example. EWI is the world's largest market forecasting firm. Its staff of full-time analysts led by Chartered Market Technician Robert Prechter provides 24-hour-a-day market analysis to institutional and private investors around the world.
About the Publisher, Elliott Wave International
Founded in 1979 by Robert R. Prechter Jr., Elliott Wave International (EWI) is the world's largest market forecasting firm. Its staff of full-time analysts provides 24-hour-a-day market analysis to institutional and private investors around the world.
© 2005-2022 http://www.MarketOracle.co.uk - The Market Oracle is a FREE Daily Financial Markets Analysis & Forecasting online publication.