Gold Seasonal Trades Analysis
Commodities / Gold and Silver 2012 Nov 20, 2012 - 10:48 AM GMTBy: Submissions
 Dimitri Speck writes: Is there such a thing as a gold season? Slogans like "Sell in May and go away" are well-known from the equity markets, and often seasonal patterns such as growing stock prices in the winter months or the year-end rally, are subject to statistical studies. Is there also a seasonal behavior in gold?
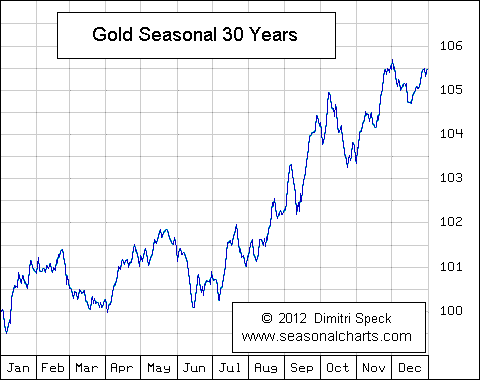
In order to spot similar patterns on the gold market, we should look at a seasonal chart first. In contrast to normal charts it does not show the price developments for a certain period. On the contrary, it shows the average price development for several years depending on the season. Therefore, an average based on the prices of 30 years is calculated. The chart's x-axis shows the month, the y-axis shows the price. Thus, seasonal patterns can precisely be recognized in the chart.

It can be seen in the chart that there are two main phases in the course of the year. From July 6 to January 17 of the subsequent year, the gold price rose by an average of 6.23%. In this period of more than six months, the gold price rose more than in the whole of the year! In 18 out of 30 years gold prices rose in this period of the year, only in 12 years they showed losses. In profitable years average yield was at 15.77%, in loss years it was at
-6.62%. On the other hand, the gold price on average fell in the time between January 17 and July 6 over a period of almost six months. The subsequent table shows the percentage yield of gold in the favorable season.
Start End Yield
7/6/2000 1/16/2001 -7.05 %
7/6/2001 1/16/2002 8.13 %
7/8/2002 1/16/2003 14.43 %
7/7/2003 1/16/2004 16.78 %
7/6/2004 1/17/2005 7.67 %
7/6/2005 1/16/2006 32.73 %
7/6/2006 1/16/2007 -1.11 %
7/6/2007 1/16/2008 34.06 %
7/7/2008 1/16/2009 -8.98 %
7/6/2009 1/18/2010 22.55 %
7/6/2010 1/17/2011 14.26 %
7/6/2011 1/16/2012 7.53 %
Is there also an autumn rally in the gold market? Even though December on average was not a favorable month, the performance from November 1 to January 16 is notable. In the last 30 years, the gold price rose by an average of 3.11% in this period with a duration of 52 trading days. That means 50% of the yield was generated in less than 20% of the year. Once again, there were 18 favorable years and 12 loss years. In favorable years average yield was at 7.76%, in loss years the gold price showed average losses of -3.48%.
How stable are these seasonal phases? How likely is a similar seasonal price development in the coming years? Among other things, that depends on the reasons underlying the measurable seasonal development. Only if these reasons exist now and in future, they can still have effects in the future and increase the chance of a price movement. Holidays are constantly mentioned - from Christmas to the Chinese New Year to India's wedding season. The purchase of gold for the use as jewelery seems to have a strong seasonal character. But what is about people who use gold only as a store of value? Here too, seasonal influences are conceivable which maybe are caused by market sentiments, political or financial accumulations, or interactions in other markets. However, these seasonal influences are more difficult to name and hardly discussed so far.
Whoever concludes that gold has a sufficiently stable seasonal price development, can not only use this as a trader but also as long-term investor, by purchasing and selling whenever prices are low or high. However even if there is a seasonal pattern exceptional years can occur in which gold prices develop is different to the average. The season can only be one of many factors influencing the price.
Dimitri Speck
www.seasonalcharts.com
© 2012 Copyright Dimitri Speck - All Rights Reserved Disclaimer: The above is a matter of opinion provided for general information purposes only and is not intended as investment advice. Information and analysis above are derived from sources and utilising methods believed to be reliable, but we cannot accept responsibility for any losses you may incur as a result of this analysis. Individuals should consult with their personal financial advisors.
© 2005-2022 http://www.MarketOracle.co.uk - The Market Oracle is a FREE Daily Financial Markets Analysis & Forecasting online publication.


