What Gold's Relative Strength Means
Commodities / Gold and Silver 2012 Nov 15, 2012 - 04:36 AM GMTBy: Jordan_Roy_Byrne
 Longtime readers of our editorials know that we are big fans of intermarket analysis as well as ardent believers in the real price of gold (real POG) or relative Gold. No this has nothing to do with the paper market versus the physical market. The real POG is essentially the POG relative to other assets and markets. There are two reasons why we track this. First, Gold priced against the other currencies (specifically the Euro) has been a leading indicator for Gold in US$ terms. Second, Gold's performance against commodities (in general) is a leading indicator for margins of the miners. We discussed this a few weeks ago. Over the weekend, I reviewed Gold's performance in relative terms and it seems to have reasserted its uptrend.
In the chart below we graph Gold against six other markets (foreign currencies, equities, oil, industrial metals, and bonds). Note that Gold is in a steady uptrend against each market with the exception of bonds.

Gold priced in the inverse of the US$ basket is only 4% off its all time high while relative to oil and industrial metals, it just reached a one year high. Gold has turned down relative to bonds as they are close to testing their all-time high. Meanwhile, the yellow metal just matched a six-month high relative to the S&P 500.
So why should we care about all of this?
First, it tells us that Gold is in a healthy bullish position because its trending higher against all major markets with the exception of bonds. In other words, Gold is showing broad strength and is only being held back by the strength in bonds, which happens to be the largest market by a mile. Thus, when we see bonds soften, Gold should have a shot to retest its recent high.
The strength in the real POG usually reflects economic contraction or deceleration. After all, if things were going well we'd expect equities and economically sensitive commodities to outperform Gold. A rise in the real POG is a negative signal for the economy and asset markets. That in itself is a catalyst for central bank action which gives liftoff to precious metals and also explains why the real POG is a trusty leading indicator.
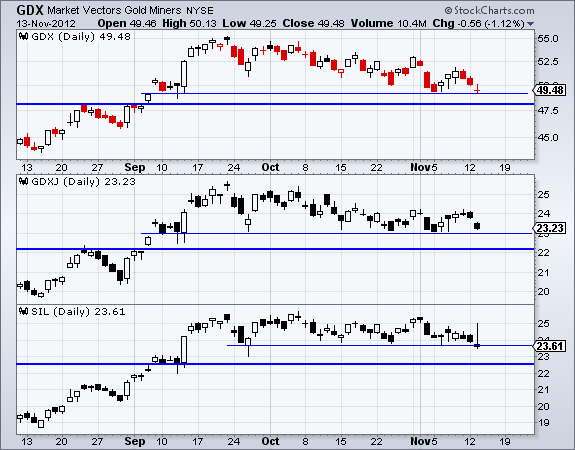
The current interpretation of the real POG bodes well for the underlying cyclical or intermediate term trend which turned bullish in May. While we are here, here are a few quick thoughts on the gold and silver shares. In the chart below we plot the two support lines for GDX, GDXJ and SIL. It appears these markets will test the lower support line.

Short term breadth indicators (courtesy of sentimentrader.com) show only 15% of gold stocks trading above their 10-day moving average and only 23% trading above their 50-day moving average. The last time both these ratios were beneath 20% was July, in which a tremendous rebound began.

To conclude, the real price of gold is trending bullish which implies good times ahead for precious metals in the coming months. The poor outlook for oil and industrial prices is a good thing for gold and silver producers as their margins could expand even further in the quarters ahead. The correction that began at the end of September is likely within days of ending. Now, with mining equities trading off their highs is the time to do your research and find the companies that will lead the next leg higher and outperform the gold stock sector.
If you'd be interested in professional guidance in this endeavor, then we invite you to learn more about our service.
Good Luck!
© 2005-2022 http://www.MarketOracle.co.uk - The Market Oracle is a FREE Daily Financial Markets Analysis & Forecasting online publication.


