Zimbabwe’s Four-Year Anniversary—From Hyperinflation to Growth
Economics / HyperInflation Nov 09, 2012 - 07:09 PM GMTBy: Steve_H_Hanke
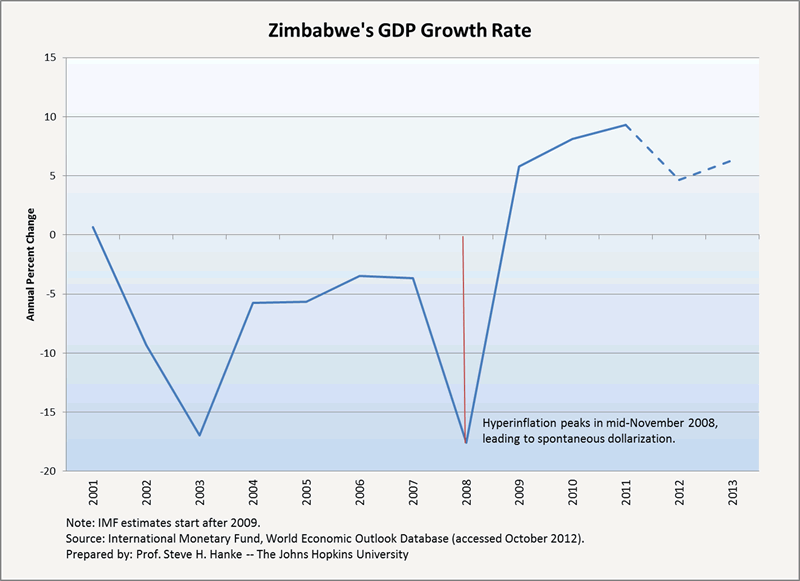
 In mid-November 2008, Zimbabwe recorded the world’s second-highest hyperinflation. Today, it can boast strong growth and single-digit inflation rates. In 2008, Zimbabwe’s annual real GDP growth rate was a miserable -17.6 percent and its annual inflation rate was 89.7 sextillion percent—that’s roughly 9 followed by 22 zeros.
So how did Zimbabwe go from economic ruin to an annual GDP growth rate of 9.32 percent in 2011, with estimates of relatively strong growth rates through 2013? As I predicted in early 2008, the answer is simple: spontaneous dollarization brought an end to the horrors of hyperinflation.
In late 2008, the people of Zimbabwe spontaneously dollarized the economy. Thiers’ Law prevailed: good money drove out bad, and the government’s hands were tied. Indeed, the government was forced to officially dollarize in 2009. Since then, Zimbabwe has enjoyed positive GDP growth rates, a feat not accomplished since 2001 (see accompanying chart).

While these achievements are cause for celebration, there are still problems in paradise: Robert Mugabe continues to hold the reins of power; Zimbabwe’s “Ease of Doing Business” ranking is a dismal 172nd out of 185; and “change” is, in short, hard to come by. In addition, the government’s external debt is now close to $12.5 billion and lending rates between Zimbabwe’s embattled banks are as high as 25 percent. To top it off, the Zimbabwean government is attempting to force banks to buy its treasury bills at significantly discounted rates, after its debt auction flopped in early October. Talk about ruling with an iron fist.
If this isn’t bad enough, Zimbabwe’s official statistics have produced a very low signal-to-noise ratio—one that, quite frankly, leaves one listening to static. Both the quantity and quality of official data, ranging from migration statistics to trade figures, are in short supply, particularly data from the period of Zimbabwe’s 2007-08 hyperinflation.
None of this comes to a surprise to me. After all, as far as Zimbabwean officials are concerned, the country’s hyperinflation peaked in July 2008, with a monthly inflation rate of 2,600 percent. After this point, Zimbabwe stopped collecting and reporting data on price changes, throwing a shroud of secrecy over the country’s hyperinflation disaster. In reality, hyperinflation continued after July 2008, growing at an exponential rate until mid-November 2008.
Alex Kwok and I lifted the shroud on this hyperinflation in our 2009 Cato Journal article. We determined that Zimbabwe’s hyperinflation actually peaked in mid-November 2008, with a monthly rate over 30 million times higher than the final inflation rate reported by the government. In an attempt to correct the government’s lying statistics, I have contacted high officials in Zimbabwe via telephone and email. But, I have been stonewalled, given a bureaucratic runaround.
The last thing the Mugabe government seems to be interested in is an accurate account of the world’s second-highest hyperinflation. Lying statistics remain the order of the day.
By Steve H. Hanke
www.cato.org/people/hanke.html
Steve H. Hanke is a Professor of Applied Economics and Co-Director of the Institute for Applied Economics, Global Health, and the Study of Business Enterprise at The Johns Hopkins University in Baltimore. Prof. Hanke is also a Senior Fellow at the Cato Institute in Washington, D.C.; a Distinguished Professor at the Universitas Pelita Harapan in Jakarta, Indonesia; a Senior Advisor at the Renmin University of China’s International Monetary Research Institute in Beijing; a Special Counselor to the Center for Financial Stability in New York; a member of the National Bank of Kuwait’s International Advisory Board (chaired by Sir John Major); a member of the Financial Advisory Council of the United Arab Emirates; and a contributing editor at Globe Asia Magazine.
Copyright © 2012 Steve H. Hanke - All Rights Reserved
Disclaimer: The above is a matter of opinion provided for general information purposes only and is not intended as investment advice. Information and analysis above are derived from sources and utilising methods believed to be reliable, but we cannot accept responsibility for any losses you may incur as a result of this analysis. Individuals should consult with their personal financial advisors.
© 2005-2022 http://www.MarketOracle.co.uk - The Market Oracle is a FREE Daily Financial Markets Analysis & Forecasting online publication.


