Crude Oil Price and Oil Stocks Seasonality, Trend Forecast
News_Letter / Crude Oil Nov 09, 2012 - 06:02 AM GMTBy: NewsLetter
 The Market Oracle Newsletter
October 30th , 2012 Issue #19 Vol. 6
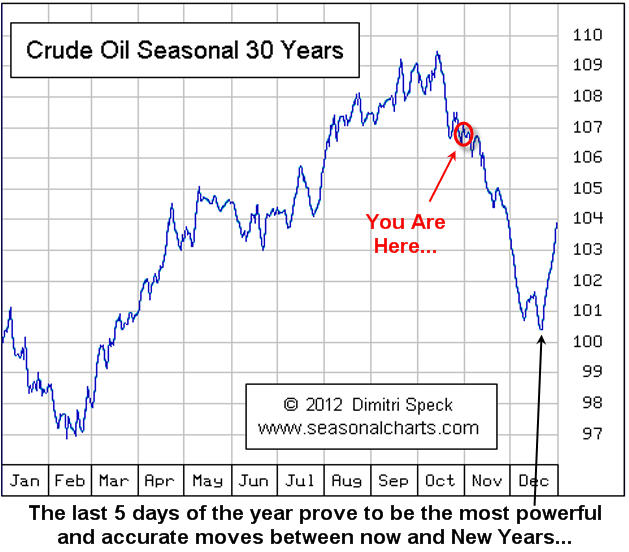
Crude Oil Price and Oil Stocks Seasonality, Trend ForecastDear Reader Chris Vermeulen writes: Crude oil has had some large price swings this year and another one may be on its way. This report shows the seasonality of crude oil along with where oil is trading and what the oil service stocks are telling us is likely to happen going into year end. Since WTI Crude Oil topped out in September at the $100 resistance level (Century Number) many traders are looking for a bounce or bottom to form in the next week. Historical charts show that on average the price of oil falls during November and the first half of December. The charts of oil and oil stocks shown below have formed patterns on both time frames (weekly & daily) that lower prices are to be expected. If you did not read my Gold Seasonality Report I just posted be sure to review it here: Gold Seasonal Report
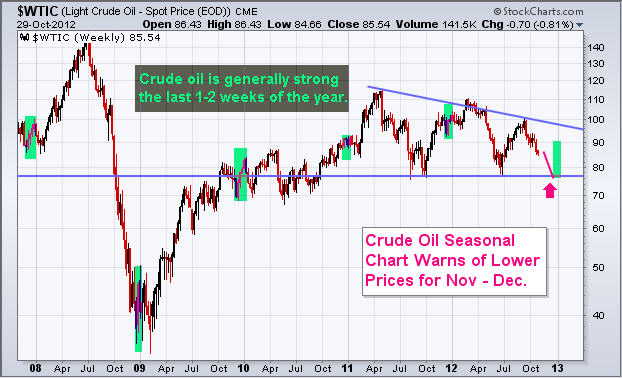
WTI Crude Oil Weekly Chart: Here you can see that price tends to fall going into Christmas and rallies during the last week of trading. This price action falls in line with Dimitri Specks seasonal chart providing us with insight as to what we should expect. Later this week I will finish my report on the Election Cycle Seasonality report which shows weakness in the market during Oct & Nov when a president is up for re-election.
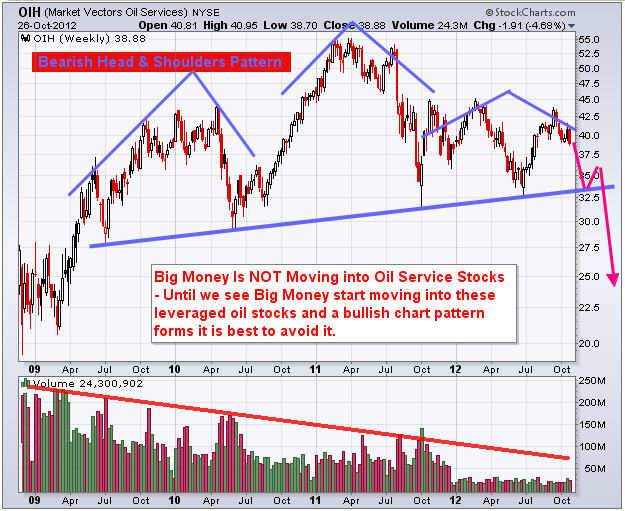
Oil Services Stocks – Weekly Chart: If you follow oil closely then you know likely know already that oil related stocks can lead the price of oil by a couple weeks. What this means is that if big money is flowing into oil stocks (bullish price patterns with strong volume), then you should expect the price of crude oil to rise in the coming days. That said, if money is flowing OUT of oils stocks then lower or sideways oil price should be expected. The weekly chart oil stocks show a very large bearish head & shoulders pattern. While I do not think the neckline will be broken it is very possible. One of the most important pieces of data on the chart is the VOLUME. Notice the lack of it… Volume tells us how much interest and power is behind chart patterns and declining volume clearly tells us these investments are out of favor currently and that big money is not moving into them.
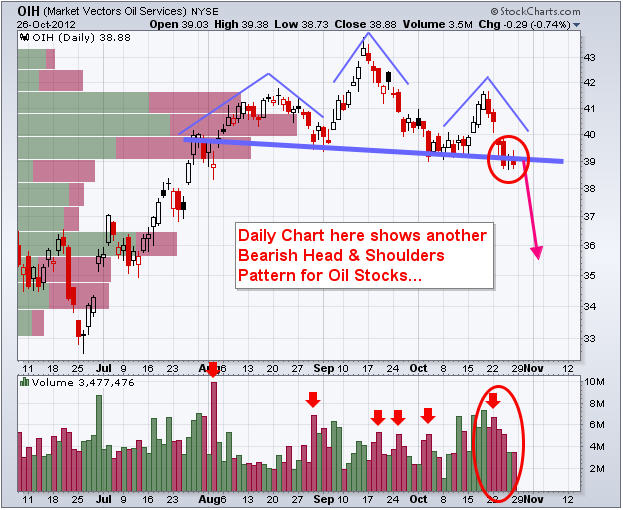
Oil Services Stocks – DAILY Chart: Zooming into the daily chart of the oil service stocks we can see there is yet another bearish pattern unfolding. Another head & shoulders pattern which looks as though it is just starting to breakdown as of this writing. Next support level is $35-36.
WTI Crude Oil and Oil Service Stocks Trading Conclusion: Looking forward 1-2 months (November – December) taking the seasonal price swings in oil, re-election cycle seasonality and price action of oil stocks I feel oil will trade sideways or down from here. With that being said, expect crude oil to rally during the last week of the year. I hope this provides some useful info for your trading! If you would like to learn more about trading and get my trading alerts visit By Chris Vermeulen Please visit my website for more information. http://www.TheGoldAndOilGuy.com Chris Vermeulen is Founder of the popular trading site TheGoldAndOilGuy.com. There he shares his highly successful, low-risk trading method. For 7 years Chris has been a leader in teaching others to skillfully trade in gold, oil, and silver in both bull and bear markets. Subscribers to his service depend on Chris' uniquely consistent investment opportunities that carry exceptionally low risk and high return. This article is intended solely for information purposes. The opinions are those of the author only. Please conduct further research and consult your financial advisor before making any investment/trading decision. No responsibility can be accepted for losses that may result as a consequence of trading on the basis of this analysis.
You're receiving this Email because you've registered with our website. How to Subscribe Click here to register and get our FREE Newsletter To access the Newsletter archive this link Forward a Message to Someone [FORWARD] To update your preferences [PREFERENCES] How to Unsubscribe - [UNSUBSCRIBE]
The Market Oracle is a FREE Financial Markets Forecasting & Analysis Newsletter and online publication. (c) 2005-2012 MarketOracle.co.uk (Market Oracle Ltd) - The Market Oracle asserts copyright on all articles authored by our editorial team. Any and all information provided within this newsletter is for general information purposes only and Market Oracle do not warrant the accuracy, timeliness or suitability of any information provided in this newsletter. nor is or shall be deemed to constitute, financial or any other advice or recommendation by us. and are also not meant to be investment advice or solicitation or recommendation to establish market positions. We recommend that independent professional advice is obtained before you make any investment or trading decisions. ( Market Oracle Ltd , Registered in England and Wales, Company no 6387055. Registered office: International House, 124 Cromwell Road, Kensington, London, SW7 4ET, UK ) |
|||||||||||||
© 2005-2022 http://www.MarketOracle.co.uk - The Market Oracle is a FREE Daily Financial Markets Analysis & Forecasting online publication.


