Nasdaq Stock Index Break its Bull Market Trendline
Stock-Markets / Stocks Bear Market Nov 09, 2012 - 05:31 AM GMTBy: Donald_W_Dony
After over three years of steady advancing, Nasdaq appears to be finally breaking its bull market trend.

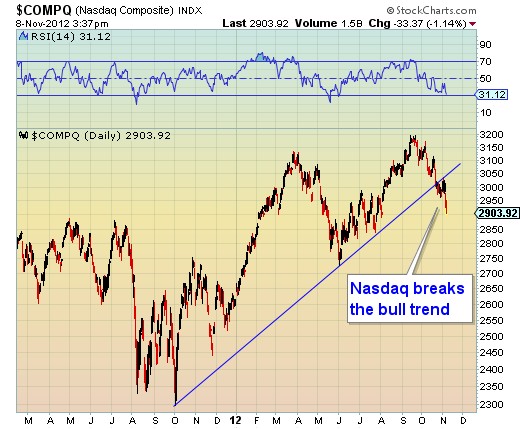
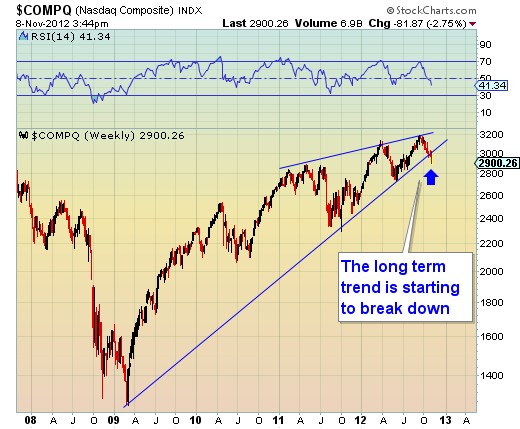
The high-tech Index began trading below its main trend line in late October (Chart 1). This line is significant. It has held Nasdaq since March 2009 (Chart 2).

Breaking the main trend line implies that Nasdaq has reached its peak and the bull market for the index is likely over.
The first lower support level in this rollover is at 2700 then lower at 2500.
Bottom line: The bull market in Nasdaq appears to be over. Lower levels can now be expected. The first downward target is at 2700.
By Donald W. Dony, FCSI, MFTA
www.technicalspeculator.com
COPYRIGHT © 2012 Donald W. Dony
Donald W. Dony, FCSI, MFTA has been in the investment profession for over 20 years, first as a stock broker in the mid 1980's and then as the principal of D. W. Dony and Associates Inc., a financial consulting firm to present. He is the editor and publisher of the Technical Speculator, a monthly international investment newsletter, which specializes in major world equity markets, currencies, bonds and interest rates as well as the precious metals markets.
Donald is also an instructor for the Canadian Securities Institute (CSI). He is often called upon to design technical analysis training programs and to provide teaching to industry professionals on technical analysis at many of Canada's leading brokerage firms. He is a respected specialist in the area of intermarket and cycle analysis and a frequent speaker at investment conferences.
Mr. Dony is a member of the Canadian Society of Technical Analysts (CSTA) and the International Federation of Technical Analysts (IFTA).
Donald W. Dony Archive |
© 2005-2022 http://www.MarketOracle.co.uk - The Market Oracle is a FREE Daily Financial Markets Analysis & Forecasting online publication.


