


Google Earnings Options Trading Idea
Companies / Options & Warrants Nov 08, 2012 - 04:26 AM GMTBy: J_W_Jones

 We recently discussed the impending release of third quarter earnings for Google (GOOG), analyzed the expected move in light of then-current options pricing, discussed the expected behavior of the implied volatility of the options, and finally constructed an option trade structure we thought had a high probability of success. I thought it would be helpful to discuss how our prognostications fared and finally to consider “lessons learned” in this exercise.
This column is essentially a trade journal entry. I would encourage all traders to make such entries routinely; each trade, whether it is economically successful or not, has an embedded lesson. No trader ever reaches the point at which he executes perfectly. The lesson has been paid for. It is foolish not to capture its message.
Google was scheduled to report earnings after the closing market bell on Thursday, October 18. It is worth noting that most options players wait until an hour or less prior to earnings release to enter earnings trades. These last minute players were completely shut out because of an unexpected early earnings release mid-day on Wednesday.
Prior to this unforeseen early release of information the stock was trading around $755. The stock immediately sold off and traded wrapped around $680 / share for the next few days. This 10% sell off was the largest move on earnings for the prior four quarters. The recent range of price moves on earnings had been between 2% and 8%.
The second portion of our prospective analysis was to calculate the anticipated move that was reflected in the options pricing. We calculated the impending move at $34.60; roughly 50% of the actual move that occurred. This means that the move on earnings was a 2 standard deviation move, a very unusual event.
Our statistics tell us that the 1 standard deviation calculated move of $34.60 / share would have contained 68% of the occurrences of the move. The actual 2 standard deviation event would have contained 95% of the movement events.
We discussed the fact that playing earnings directionally is difficult. Obviously those sufficiently prescient to predict this massive sell off and structure appropriate options positions did well. In this particular case, simply buying puts would have been a profitable strategy since the move was so much larger than anticipated.
However, it is critical to realize that a trading strategy that can survive over the long haul cannot be based on statistically improbable events. Traders who simply buy options ahead of earnings release are engaging in low probability strategies that will not be successful when used over a sufficient number of events that the probabilities are realized.
We considered the example of a high probability trade, a triple calendar. This trade was designed to deliver profit over a wide range of prices and profit from the anticipated volatility collapse on the front month contracts.
To recap, the original P&L curve is presented below:
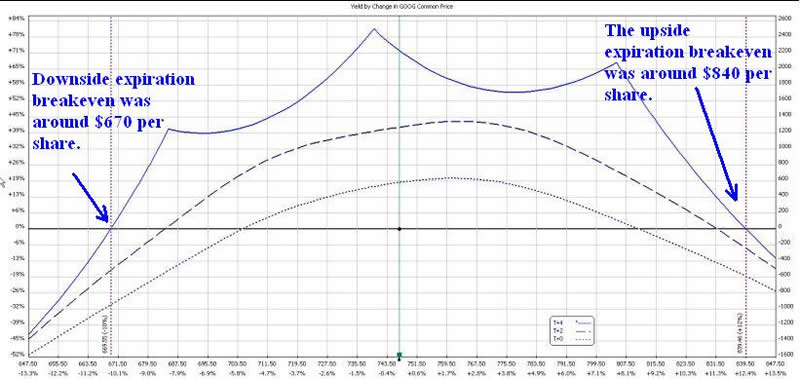
This trade was designed to be short term and was planned to conclude on the Friday following earnings. The original break even points for the trade were around $670 and $840 and were outside double the expected move. The trade had approximately a 90% chance of profitability.
At expiration on Friday, the planned duration of the trade, the price of GOOG was $682, within the initially projected zone of profitability. So how did the trade do?
It was a scratch, losing $8. The reason for the loss was that the collapse in implied volatility extended to the December series options we were long to a greater degree than anticipated.
While a negative economic outcome is never welcome, I feel quite good about the result in light of the magnitude of the price move. I feel this is an example of how a well constructed trade exposes the trader to minimal loss even when price movements occur well outside the predicted range.
Happy Trading and Investing!
 Simple ONE Trade Per Week Trading Strategy?
Join www.OptionsTradingSignals.com today with our 14 Day
J.W. Jones is an independent options trader using multiple forms of analysis to guide his option trading strategies. Jones has an extensive background in portfolio analysis and analytics as well as risk analysis. J.W. strives to reach traders that are missing opportunities trading options and commits to writing content which is not only educational, but entertaining as well. Regular readers will develop the knowledge and skills to trade options competently over time. Jones focuses on writing spreads in situations where risk is clearly defined and high potential returns can be realized.
This article is intended solely for information purposes. The opinions are those of the author only. Please conduct further research and consult your financial advisor before making any investment/trading decision. No responsibility can be accepted for losses that may result as a consequence of trading on the basis of this analysis.
© 2005-2022 http://www.MarketOracle.co.uk - The Market Oracle is a FREE Daily Financial Markets Analysis & Forecasting online publication.