Apple Stock Regression Analysis Price Forecast 2013
Companies / Tech Stocks Nov 06, 2012 - 10:54 AM GMTBy: Richard_Shaw
 Apple is in a bearish condition at the moment, with swirling questions about its management changes, product roll-outs, and competition, as well as the 2012 Christmas shopping season. There is also the possibility that some of the current selling pressure may be due to an extra level of year-end selling due to upper income investors deciding to realize profits before the increased gains taxation expected in 2013.
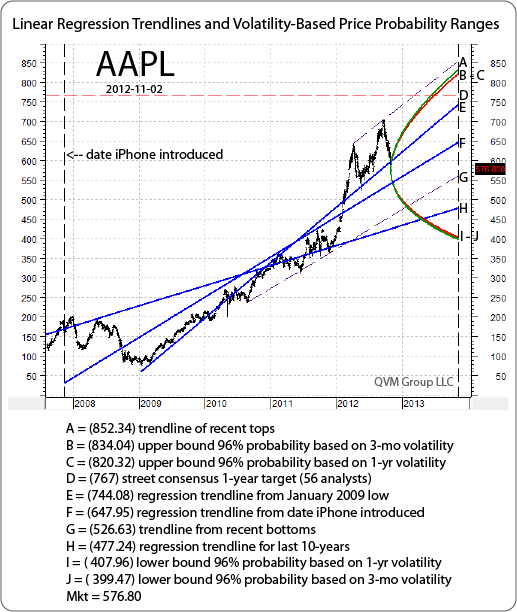
This post looks at three perspectives on the future price of Apple (AAPL) out a year, based on price projections from historical charts using (a) regression trendlines and volatility-based price probability ranges, and simple trendlines drawn from recent tops and bottoms, (b) analyst 1-year target prices, and (c) price level probabilities based on options implied volatility for two contracts with expiration dates that straddle the 12-months ahead ending in November 2013.
The historical data by definition is backward looking, and is used in the statistical regression extensions and volatility-base price probability range to guesstimate the future assuming a continuation of past price behavior. The options data is forward looking by traders placing their capital at risk now based on their assumptions about the future.
It is important to keep in mind that the options implied outcomes are likely to change more, and more frequently, than statistical projections based on historical data, and probably more than average analyst price targets. Options data does however reflect what people who are risking their capital believe about the future, whereas analysts may not be risking capital; and historical data incorporates less and less of an anticipation of the present situation and current future assessment as we go back in time. We think it is a good idea to be aware of all three perspectives.
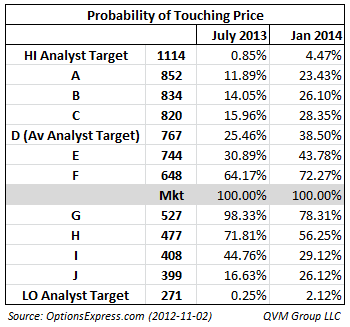
Figure 1 shows the history driven November 2013 projections (plus the average analyst projection), while Figure 2 shows the probability of those history driven projections being achieved sometime during the life of two options expiration dates (July 2013 and January 2014) that straddle the November 2013 year ahead projection
The average analyst 1-year target price of 56 analysts at 767 is almost 33% above the current market price. The highest analyst 1-year target is 1,114 and the lowest analyst target is 271.
Figure 1:

The options volatility implied probability of each of the price levels cited in Figure 1 being touched sometime during the life of the option contract is shown in Figure 2.
There is no November 2013 options contract for Apple, so we can’t get an exact view of traders perspectives of the history-based projections. However visual interpolation suggests that the two option contracts that straddle November 2013 give the average analyst 1-year target price having about a 1 in 3 chance of being achieved.
Figure 2:

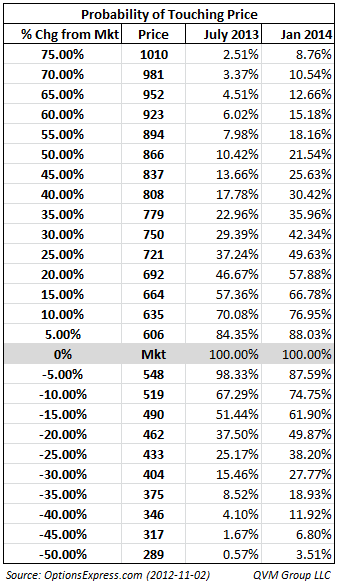
The probabilities in Figure 3 are for the price of Apple achieving prices at 5% increments from the current market price during the lifetime of the July 2013 and January 2014 options contracts.
Figure 3:

Disclosure: QVM has positions in AAPL as of the creation date of this post.
By Richard Shaw
http://www.qvmgroup.com
Richard Shaw leads the QVM team as President of QVM Group. Richard has extensive investment industry experience including serving on the board of directors of two large investment management companies, including Aberdeen Asset Management (listed London Stock Exchange) and as a charter investor and director of Lending Tree ( download short professional profile ). He provides portfolio design and management services to individual and corporate clients. He also edits the QVM investment blog. His writings are generally republished by SeekingAlpha and Reuters and are linked to sites such as Kiplinger and Yahoo Finance and other sites. He is a 1970 graduate of Dartmouth College.
Copyright 2006-2011 by QVM Group LLC All rights reserved.
Disclaimer: The above is a matter of opinion and is not intended as investment advice. Information and analysis above are derived from sources and utilizing methods believed reliable, but we cannot accept responsibility for any trading losses you may incur as a result of this analysis. Do your own due diligence.
Richard Shaw Archive |
© 2005-2022 http://www.MarketOracle.co.uk - The Market Oracle is a FREE Daily Financial Markets Analysis & Forecasting online publication.


