


Gold Black Hole Friday?
Commodities / Gold and Silver 2012 Nov 06, 2012 - 10:41 AM GMTBy: Ned_W_Schmidt

Guess the question is obvious: What the @#$% happened to Gold Friday?
The morning actually seemed to start off fine. U.S. reported on the number of jobs added last month. It was a good number, +171,000. That was the second month in a row with something good in this report. With the U.S. mired in the longest running period of high unemployment since the last great failure of Keynesian economics, the Great Depression, this report should have been welcome news. Instead, Gold, and most other markets, seemed to plunge into a black hole.
Are the numbers being manipulated? While that word might be too strong, it seems to work fine for many. But remember, these numbers are not real numbers. The final estimates are not the output of "bean counters", but those of economists and statisticians. These numbers are a collection of estimates. Some of those estimates are really squishy, SWAGs. A good example is the net birth/death adjustment(See http://www.bls.gov/web/empsit/cesbd.htm) Like all statistical estimates a lot of guessing exists, and the guessers have some discretion in their guesses. The data, suddenly two months before the national election, seems to be interpreted in a positive manner.
Until Friday morning the market had been assuming that the Federal Reserve would keep making QE-3 bigger and bigger. That belief was supporting Gold, even though it had already rolled over. Note our past comments on how the mini parabolic had already been broken. We have noted several times that the failure of this pattern is always associated with pain. Friday was part of that pain, but perhaps not all of it.
Bernanke, and the other members of the FOMC, have continually said they are watching the employment number in their formulation of monetary policy. If unemployment goes down, they may begin, ever so slowly, to tighten policy. While two good numbers are not going to change Fed policy any time soon, it changed the thinking of the market. Friday it went from thinking the FOMC was never, ever going to tighten to perhaps some time out there in the future it just might tighten.
That may not sound like much, but it was a major change in the thinking of the market. Some seeds of doubt were sown in the minds of those counting on QE-3 expanding. That all may not sound like much, but it is a "discontinuity" in the thinking, and a change at the margin. That is actually a powerful force in markets. Note how the change of thinking impacted everything, from Gold to equities to oil to corn.
On Friday Gold seemed to have no bottom. This reaction is both typical of the breakdown of a parabolic formation, and is rarely reversed in a matter of days. Gold is going to be very vulnerable to selling, and buyers may be few. Remember, we are not talking about cash buyers driving the Gold market down on Friday, or in recent weeks. Immature traders, acting without adult supervision, were selling in the futures markets in lemming like fashion.
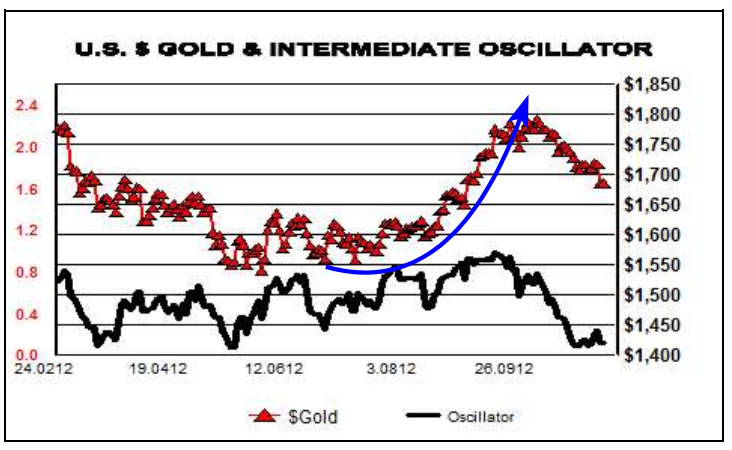
In the above chart we have highlighted the mini parabolic curve which Gold had traced out in anticipation of QE-3. The break with that formation was already in place. The U.S. labor report simply kicked it harder when already declining. Gold broke down in the charts on Friday morning, and that damage may not be repaired for some time. Though we remind that markets never move in straight line and that some bounce off an extremely oversold condition is always possible.
As a discontinuity, we can almost throw out that part of the chart before Friday. And contrary to the suggestions of some, chart damage did occur. The break below $1,700 is readily apparent in the chart. All the trading above that level in recent times is now over heard supply that must be cleared. A complete rebuilding of the chart is necessary, quite possibly from lower levels.
Like every story this one too has both good and bad news. In the above we reported on the bad news that has developed. The good news is that if significantly lower price for Gold develops between now and a year end some investors will be able to take advantage of the situation. Should Gold sell off in this year end period investors should be accumulating Gold. Regardless of the winner of the U.S. election, politicians and Keynesian quacks will still be in charge of Western economies.
By Ned W Schmidt CFA, CEBSCopyright © 2011 Ned W. Schmidt - All Rights Reserved
GOLD THOUGHTS come from Ned W. Schmidt,CFA,CEBS, publisher of The Value View Gold Report , monthly, and Trading Thoughts , weekly. To receive copies of recent reports, go to www.valueviewgoldreport.com
Ned W Schmidt Archive |
© 2005-2022 http://www.MarketOracle.co.uk - The Market Oracle is a FREE Daily Financial Markets Analysis & Forecasting online publication.