United States Continuing Decent into Debt Will Push Gold Price Higher
Commodities / Gold and Silver 2012 Oct 31, 2012 - 11:14 AM GMT Way back in the 1970’s the US began a fateful transition, a transition where we started to confuse the concept of an asset with that of a debt. After the Great Depression it was frowned upon to have debt and that included mortgages on a house, and when a mortgage was paid off all the neighbors would get together and celebrate the event. In fact they would usually burn the cancelled document after consuming a reasonable quantity of alcohol! Well, those days are long gone. Thanks to the Alan Greenspan’s and Ben Bernanke’s of the world, debt was mistaken for an asset. The biggest offender, and role model for the world, is of course the US Federal Reserve.
Recently we hit a milestone of sorts, generally associated with banana republics, as debt exceed 100% of GDP. What is the significance of having too much debt? Does it even matter? If Washington is any indication, it doesn’t matter since they can’t even agree to sit down and discuss the issue. That’s how you get to the point where Total US Public Debt to GDP now stands at over 100 percent. That is, we have a larger public debt than what we produce per year as an entire nation. To put this debt growth in perspective, we should look at the debt growth over time, all the way back to the 1950s:
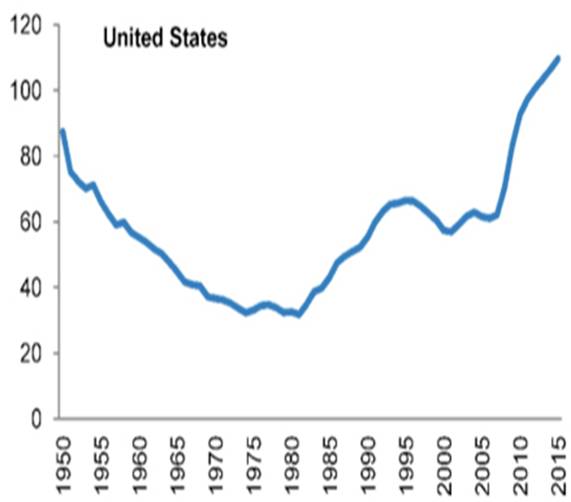
The last time this occurred was during World War II, and to make matters worse we are not alone. Europe is dealing with massive debt as well and many countries within the union are in depressions like Spain and Greece. Then there is Japan, and even China is going down the same road as it consumes its hard-earned foreign reserves in an effort to avoid the unavoidable. There now seems to be an impact on the real economy with every increase in the public debt. Finally, there isn’t a fast rule of thumb as to what is the maximum level of debt, but going over 100 percent of our GDP is not exactly a good thing. That’s why growth is slowing and unemployment remains high in spite of all the quantitative easing. It’s also why interest rates are inching higher in spite of declarations by the Fed to the contrary.
The old saying that every storm cloud brings with it a silver lining holds true here, although I would be more tempted to say it is a gold lining. With all the printing and debt creation going on around the world, it creates a perfect atmosphere for gold and silver. This is aided by the fact that most of today’s generation has no idea that gold and silver actually served as money for three thousand years. They also don’t know that fiat currency, an experiment that began four hundred years ago, has yet to produce even one successful example. Every single fiat currency released upon the world over the last four hundred plus years has ended the same way, with a piece of paper worth zero. No exceptions!
Our Founding Fathers were wise men and they knew all of this, so they took great pain to include in the US Constitution and provision that only gold and silver coins would be money. Later generations of politicians succumbed to outside pressures (money being thrown at them) and in 1913 decided that we needed a central bank and a fiat currency. That one moment in time began the US’s transition from the world’s largest creditor nation to what we have today, the world’s largest debtor nation. The fiat experiment in the US (and the Euro) will end like all its predecessors, in disaster.
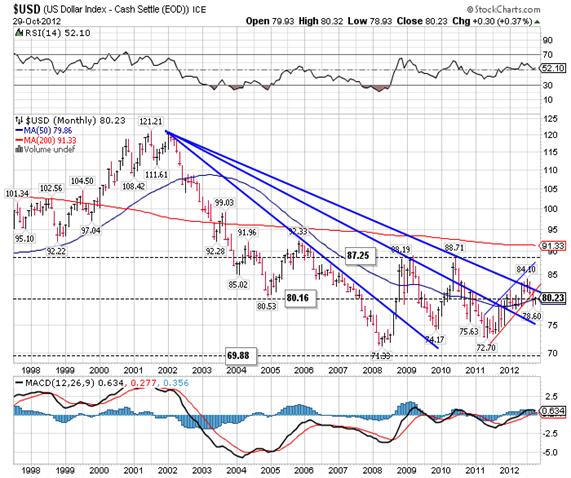
Since 1913 the US has wriggled free of the gold standard and today the US dollar is backed by the “full faith and credit” of the US government. Of course that begs the question of how much faith you can have in the credit of the world’s largest debtor? Perhaps that the real reason the US dollar has been loosing value for more than a decade, as you can see in the chart above. I also don’t think it’s a coincidence that gold began to move higher at almost exactly the same time that the dollar began to fall:
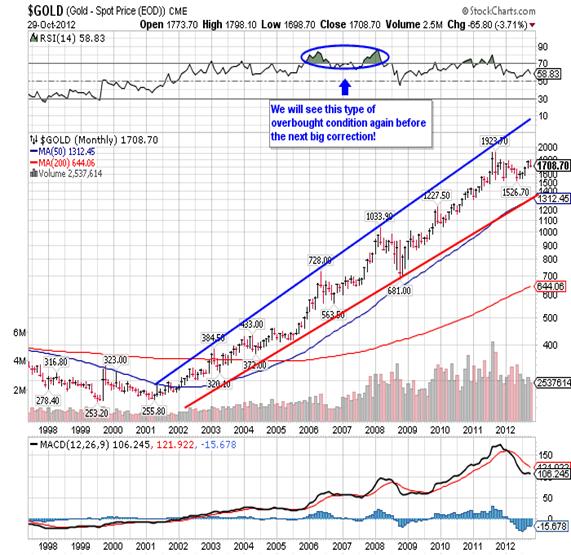
Interestingly enough the dollar has declined even though the US has declared a “strong dollar” policy for the last ten years. Even more interesting is the fact that the Fed, together with the world’s major central banks, has done everything possible to suppress the price of gold. It just goes to show that the primary market will express itself regardless of who or what tries to interfere.
More recently gold has been the focus of attention as it has been more than one year since it made a new all-time closing high, and many are once again declaring an end to the bull market:
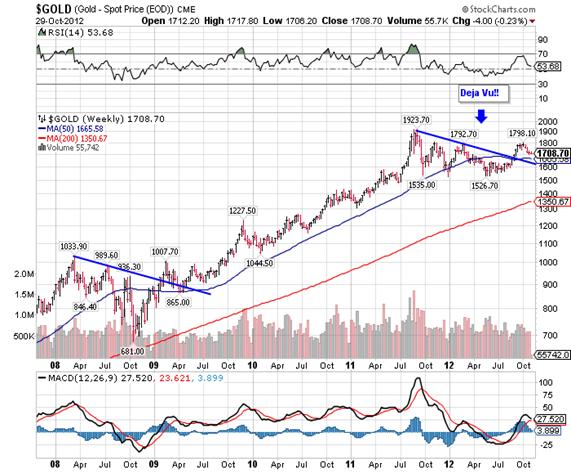
One of the real problems we have in today’s world is our inability to see beyond tomorrow, and inversely to remember anything that happened the day before yesterday. If the average investor would simply take a look at the previous chart, he would know that we’ve been down this road before. The decline that gold suffered in 2008 was almost identical to what it suffered through over the last thirteen months. In fact the most recent decline was a lot shallower (20% versus 27% in 2008), but no one remembers that. Bloomberg tells us that gold is all done, so we take that as gospel.
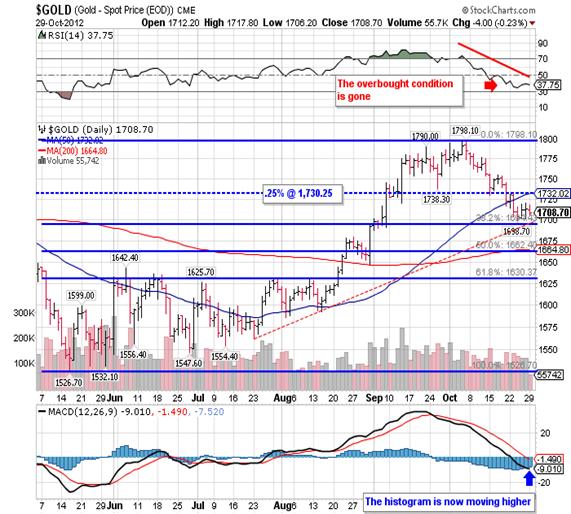
In this last chart you can see that gold traded as high as 1,798.10 in early October and then retraced almost precisely 38.1% of its move up off the 2012 low. This happened over thirteen days and that is a second-degree reaction and nothing out of the ordinary. The fact that it did not exceed 38.1% keeps the strong move up intact and was in fact the moment to purchase gold. Since last Wednesday’s closing low of 1,704.60, gold has been undergoing accumulation in a tight range. Today it moved up out of that range and is trading at 1,724.00 as I type. In the process we have our third straight day of higher lows and higher highs as it moves to test resistance at 1,730.25.
Finally, many pointed to the fact that gold could not move above the 1,800.00 area, but those people fail to see that gold in fact did produce both a new intraday high as well as a new closing high for 2012. With that said I view resistance at 1,800.00 as more psychological than anything else. The yellow metal will face good resistance at 1,756.20, and then noth-
CONTRACT SUPPORT RESISTANCE
Spot Gold 1,671.5 1,756.2
1,596.8 1,820.9
1,895.5
ing significant until it hits 1,820.90. I have no doubt that gold will move beyond 1,800.00, as well as 1,820.90, and before the year is out could challenge the resistance at 1,895.50 that produced the 2011 all-time high. Of course there will be declines along the way, but they will be first or second degree declines and relatively shallow, not to exceed 7.5% in the extreme. More importantly they will represent good buying opportunities as gold works its way up to 2,400.00 and beyond.
Giuseppe L. Borrelli
www.theprimarytrend.com
analyst@theprimarytrend.com
Copyright © 2012 Giuseppe L. Borrelli
- All Rights Reserved Disclaimer: The above is a matter of opinion provided for general information purposes only and is not intended as investment advice. Information and analysis above are derived from sources and utilising methods believed to be reliable, but we cannot accept responsibility for any losses you may incur as a result of this analysis. Individuals should consult with their personal financial advisors.
© 2005-2022 http://www.MarketOracle.co.uk - The Market Oracle is a FREE Daily Financial Markets Analysis & Forecasting online publication.


