Oil Stocks vs. Crude Oil and S&P Stock Market Index
Commodities / Oil Companies Feb 15, 2008 - 01:31 PM GMTBy: Zeal_LLC

 Crude oil's fundamentals are extraordinarily bullish. Global demand for oil is growing relentlessly, and most consumers have little choice but to pay virtually any price for this critical fuel. Meanwhile global production growth is slowing as old oilfields deplete and major new finds become exceedingly rare. This structural deficit has driven oil prices to record highs, leading to fortunes earned by the companies that produce this scarce and valuable commodity. Investors and speculators have naturally migrated into oil stocks to ride this secular trend. But lately owning the oil stocks has been an exercise in frustration.
On January 2nd, oil surged 3.4% to a record $99 per barrel. Yet the oil stocks seemed to ignore this driver of their profits as the flagship XOI oil-stock index lethargically hiccupped 0.2% higher. Then over the first three weeks of January, the XOI plunged 16% far outpacing the general stock-market slide. Yet oil averaged $94 on close over this entire period, an extremely profitable level for the oil producers.
To see oil stocks struggling in the face of extraordinary oil prices has really fanned fears among traders. If the oil stocks can't thrive in this environment, will they ever? And if long-term profits drive their stock prices, why are they seemingly ignoring high oil prices which will drive massive long-term profits? Do weak oil stocks betray a bearish structural problem in the world oil markets?
Thankfully nothing so dire is necessary to justify the recent XOI weakness. The XOI's seemingly deviant behavior actually makes sense when considering just how unique oil stocks are as a sector even among commodities stocks. Instead of serving one master, oil, they are constantly torn between two masters.
As the commodity bull underlying a specific commodities-stock sector matures, the trading behavior of the stocks that produce this commodity evolves. Initially off of secular bear lows, no one is interested in the beaten-down stocks but hardcore contrarians. They buy these unpopular stocks when the commodity they produce rises. This creates a high correlation between the commodity and the stocks that produce it.
And this is what traders expect to see on a daily basis. If oil rises then the oil stocks darned well better follow it higher! But as a sector bull matures, more and more traders get interested in it and buy in. Eventually this once contrarian-dominated sector becomes so widely-held that it goes mainstream. It gradually becomes just another general stock-market sector highly correlated with headline stock-index movements.
Unlike smaller sectors like gold stocks still dominated by contrarians, oil stocks have gone mainstream. They make up a large fraction of the S&P 500 (SPX) and virtually every investor has some oil-stock exposure. The money managers trading these stocks for their funds trade them as merely another general stock sector. They buy oil stocks when the stock markets rise and sell them when the markets fall.
Thus oil-stock traders need to understand that XOI performance is almost as dependent on the fortunes of the SPX as it is on the fortunes of oil itself. If both oil and the SPX are strong, the oil stocks should soar. But if either oil or the stock markets are weak, the XOI will struggle along. Oil stocks, due to their massive size and widespread mainstream ownership, are now torn between serving two masters.
In order to define high-probability-for-success buy and sell points, oil-stock traders have to simultaneously game the short-term trends in both crude oil and the general stock markets. Oil stocks were weak in early January because the SPX was getting crushed, not because anything is wrong with them or the oil markets. When timing oil-stock trades, the high correlation between the XOI and SPX must always be considered as a major factor.
I've been studying the interaction of the XOI with oil and the SPX since this oil-stock bull was born, but haven't written on it publically for several years . Since morale among oil-stock traders is pretty low these days thanks to January's XOI selloff, I decided to update my research this week. It considers the behavior of the XOI through the lenses of both the oil price and the SPX.

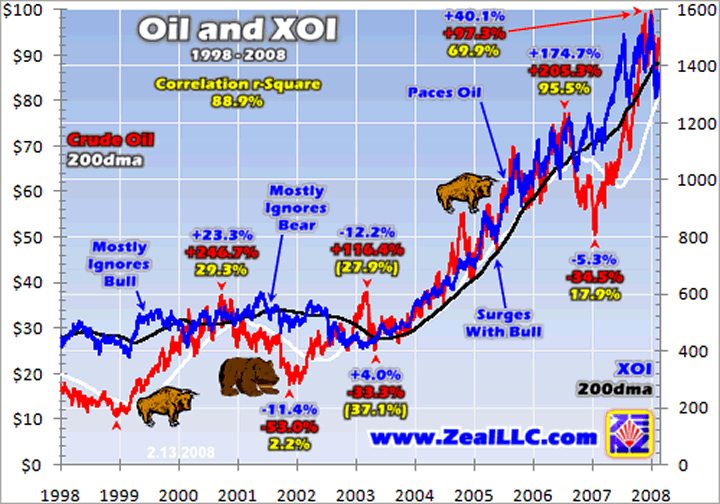
Today's secular oil bull launched in December 1998 when oil prices fell to a now unthinkable $11 per barrel! In the decade since, the XOI did exhibit a strong positive daily correlation with the crude oil price just as traders expect. The correlation r-square over this entire span was a stellar 88.9%. In other words, 89% of the daily price action in the XOI was statistically explainable by the daily price action in crude oil.
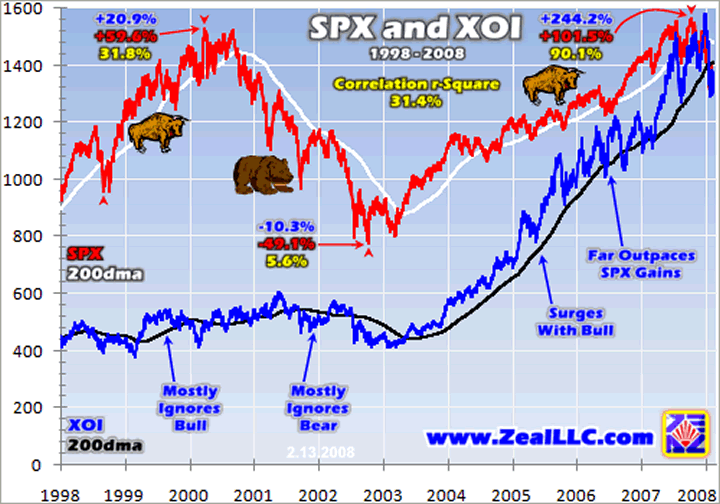
But for my research this week I'm more interested in how the XOI did during major moves in oil and the SPX. So in each of these charts I marked off big swings in oil and the SPX to compare with the XOI's performance. For each big swing in oil or the SPX, its gains/losses along with the XOI's gains/losses over the same time period are noted. Each swing's correlation r-square is also shown, with negative numbers representing underlying negative correlations.
As you digest these charts, realize these big swings are optimized for oil and the SPX, not the XOI. The interim lows and highs used to measure the gains/losses are based off oil or the SPX, with the XOI measured from the very same days. Thus these XOI gains/losses do not reflect individual XOI uplegs and corrections, but the XOI's behavior over precise oil and SPX big swings.
In order to explore the influence of oil and the SPX on the XOI, this approach seems logical. In the future though I'd like to further this research by looking at the XOI's correlations with oil and the SPX over exact XOI uplegs and corrections, XOI-optimized. This opposing perspective will help deepen our understanding of the reality of the XOI's constant battle between following oil and following the SPX.
Provocatively between 1999 and 2002, oil stocks really didn't follow oil all that well. Oil soared 247% in a mighty cyclical bull in 1999 and 2000, yet the XOI gained a trivial 23%. After mostly ignoring that oil bull, the XOI also mostly ignored the following oil bear. Leading into late 2001 oil plunged 53%, but the XOI barely bled in sympathy with a trivial 11% loss. Oil stocks don't always follow oil prices.
In fact, from late 2001 to early 2003 oil rocketed 116% higher. You'd think that would really help the oil stocks, right? Interestingly the XOI actually fell 12% over this same period of time. If you think January 2008 was a tough time to own oil stocks, that was nothing compared to 2002. Not surprisingly the culprit weighing on oil stocks in both periods was identical, a weak SPX.

Over the past decade the XOI's daily correlation r-square with the SPX was only 31%, far lower than the XOI/oil's 89%. Yet this low correlation is somewhat misleading, as there were two very distinct periods of XOI/SPX correlation. The first one prior to the end of the SPX's cyclical bear in late 2002 witnessed very low correlations, while the second one since late 2002 witnessed very high correlations.
Leading into the SPX secular top in early 2000, the XOI mostly ignored the stock bull. Oil prices were dismally low and traders were enamored with “new economy” stocks anyway. Who wanted to own old-economy oil stocks when high-flying Internet stocks were soaring? Not really participating in the bull, and hence not getting overbought, the XOI was able to largely ignore the resulting SPX bear too. It only fell 10% compared to 49% for the SPX and they were totally uncorrelated on a daily basis.
But if you look closely at the red SPX and blue XOI lines above in 2001 and 2002, there is definite influence from time to time. On a short-term basis the XOI was weakest when the SPX was plunging into its sharp V-bounces marking the ends of its major downlegs. Even back then, before oil stocks were as widely-held as today, they still had a strong tendency to get sucked into any serious general stock selling.
But since that SPX bear bottomed in late 2002, the XOI/SPX correlation r-square has soared above 90%! This is very high and means that 90% of the daily up-and-down action in the XOI was statistically explainable by the daily action in the SPX. Interestingly the XOI didn't just pace the SPX bull, the XOI amplified it considerably. It soared 244% from late 2002 to late 2007 compared to just 102% for the SPX.
This offers a very important lesson for investors. If you expect a cyclical bull in the SPX, you'll probably make a lot more money in oil stocks than in general stocks. Not only are the underlying oil fundamentals more bullish than almost any other sector's underlying fundamentals, but oil stocks still trade at P/E ratios well below the general market's. They're a bargain. At the end of January 2008, the XOI was only trading at 10.6x earnings compared to 18.7x on the SPX!
Financial and technology stocks are a whole lot sexier than oil stocks, no doubt. But financial and technology products can be easily replicated as the barriers to entry for competitors are relatively low. If prices of products soar, new competitors spring up within months to erode sector profits. Meanwhile it takes years or decades to find new oil deposits and bring them into production, no matter how high oil prices go. So big oil companies face far less competition for fat profits than any other sector.
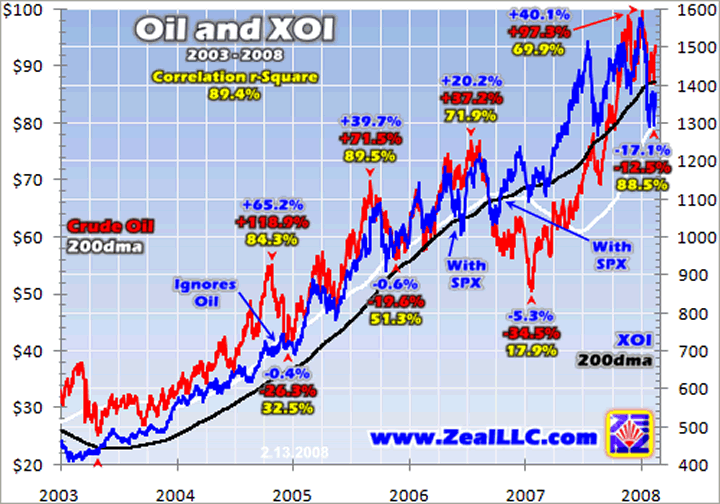
After this strategic perspective on XOI correlations with oil and the SPX over a decade's worth of big swings, I wanted to zoom into the dazzling bull markets of the last five years. It was a fantastic environment for the oil stocks, with both oil and the SPX rising relentlessly on balance. Since 2003 the XOI's correlation r-square with oil ran 89.4% compared to 89.9% for the SPX. So both key drivers were very important for XOI performance.

The r-squares of the XOI to oil's big swings since early 2003 are generally pretty high. And indeed visually the XOI seems to closely follow the oil price most of the time. Any r-square over 65% or so (a 0.80+ positive underlying correlation) is important for traders to consider. Since the XOI is this highly positively correlated with oil, gaming the short-term oil trend is obviously critical to success in oil-stock trading.
But if you look carefully, there are certainly exceptions to the rule of the XOI following oil most of the time. In late 2004, oil surged dramatically yet the XOI largely ignored it and barely budged. In mid-2006, the XOI fell sharply despite oil merely grinding sideways near record highs. In late 2006, the XOI actually rose to new highs of its own despite oil plunging. So there is plenty of precedent for the XOI ignoring oil from time to time.
And if you investigate these seemingly anomalous episodes when oil doesn't drive the XOI, including January 2008, the vast majority of the time the SPX is the culprit. The XOI plunged in mid-2006 in sympathy with a sharp selloff in the SPX. As just another sector widely held by mainstreamers, professionals dumped oil stocks just like everything else when the markets started looking scary.
And in late 2006 the XOI surged because the SPX was soaring higher. Mainstream money managers were pouring capital into oil stocks despite the sharp oil correction so the XOI rose. Late in this brutal correction during its terminal plunge into January 2007 the XOI started following oil again, but only briefly. At any given time the SPX seems to have almost as good of chance of driving the XOI as oil itself.
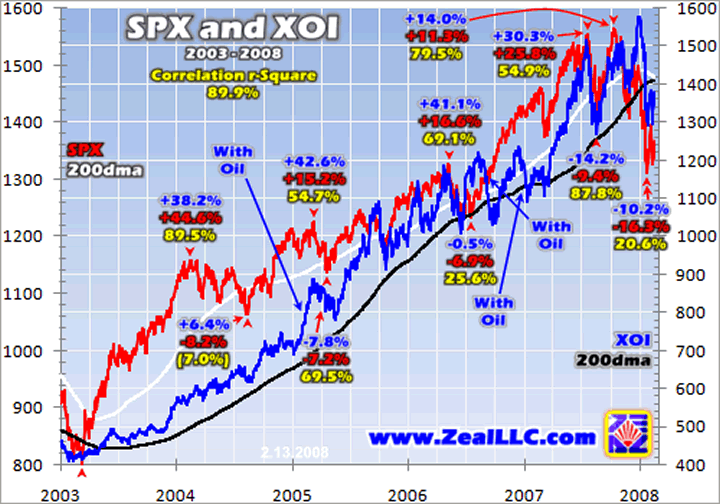
This next chart views the XOI bull market since early 2003 from the perspective of the SPX. I found these two bull charts to be the most valuable and useful when considered simultaneously. Just like the XOI followed oil most of the time in the chart above, it follows the SPX much of the time in this chart. And whenever the XOI diverges from the SPX for a season, oil is usually the cause.

By this particular division of major SPX uplegs, the average XOI r-square with the SPX in its uplegs ran 69.5%. This is considerably lower than the 78.9% average from the previous chart's rendering of major oil uplegs. So despite the SPX's slightly higher r-square (89.9% vs. 89.4%) over this entire span, oil is still more important as an XOI driver than the SPX. Indeed this is also evident visually, as the XOI and SPX lines are not quite as tight as the XOI and oil lines.
The biggest short-term divergences seen here are all the result of oil. They include the XOI surge in early 2005 despite a flat SPX and the sharp XOI corrections in mid- and late 2006 despite a surging SPX. So if you are a mainstream money manager or stock trader and you see the XOI not performing as you expect relative to the SPX, look to oil for answers.
The most fascinating portion of these two charts occurred between the third quarter of 2006 and the first quarter of 2007. A peculiar combination of circumstances drove oil to plunge in its biggest correction of this bull while the SPX simultaneously surged in its biggest rally since 2003. So what did the XOI do with its two primary drivers diverging so wildly? It carefully trod the middle path between both!
Look at this specific Q3'06 to Q1'07 period while scrolling back and forth between these last two charts. The XOI performed far better than oil reflecting the SPX rally's positive influence but far worse than the SPX reflecting oil's negative influence. The XOI was struggling to serve two masters, doing neither one justice but instead waffling between them. If you want to trade oil stocks, you have to weigh the SPX's fortunes almost as heavily as oil's.
The best of all worlds is when both oil and the SPX are rising. Mainstream capital floods into oil stocks as index funds buy all the stocks of the SPX, including the oil majors. Meanwhile commodities-oriented funds park larger fractions of their capital in oil stocks to ride oil's underlying gains. The result is oil stocks rise with, and nicely amplify, the underlying gains in both oil and the SPX.
But if either oil or the SPX is weak, oil stocks won't fare as well. In situations where the weak driver is just gradually grinding lower, the XOI can often ignore it or even overcome it and latch on to its other strong driver. But if either driver is plunging, the fear rapidly spreads to oil stocks. So if you see oil or the SPX plunge in a sharp correction, expect the XOI to get dragged down with it even if the other driver is doing well.
And if both oil and the SPX plunge sharply, the oil stocks are going to get slaughtered. If you ever expect an oil correction to happen to line up temporally with an SPX correction, just get out of oil-stock trading positions and consider gaming the short side. Just as oil stocks tend to rise way faster than the SPX when oil is strong, they tend to fall way faster than the SPX when oil is weak. Profits leverage is a sharp double-edged sword.
As lifelong students of the markets at Zeal, we try to consider all material factors driving commodities stocks. For the larger sectors, general stock-market performance is crucial. We launch new trades accordingly based on how all these factors, including the oft-overlooked ones, are lining up. You could devote many years to studying this stuff as we have, or you could simply reap the fruits of our long research and hard-won wisdom.
We offer acclaimed monthly and weekly newsletters that summarize what we are doing in terms of real-world commodities-stock trading based on the sum of all our research. By subscribing you can learn a great deal, see the logic underlying all our trades, and mirror them yourself to harvest your own profits. Subscribe today and build your own fortune riding these awesome global commodities bulls!
The bottom line is oil stocks are not solely driven by oil. The larger a sector gets, the bigger the market capitalizations of its companies and the more traders who own them, the more general stock-market action also drives this sector's performance. In order to successfully trade these sectors, both the underlying commodity price and general stock-market action must be actively gamed.
In the case of oil stocks, they still have a higher correlation with oil which is logical since it drives their ultimate long-term profits. But they also have a high correlation with the SPX which can really affect them over the short term. So if you traffic in oil stocks, realize that they are sometimes torn between serving two masters. Don't trade them in a vacuum without considering prevailing stock-market trends.
By Adam Hamilton, CPA
So how can you profit from this information? We publish an acclaimed monthly newsletter, Zeal Intelligence , that details exactly what we are doing in terms of actual stock and options trading based on all the lessons we have learned in our market research. Please consider joining us each month for tactical trading details and more in our premium Zeal Intelligence service at … www.zealllc.com/subscribe.htm
Questions for Adam? I would be more than happy to address them through my private consulting business. Please visit www.zealllc.com/adam.htm for more information.
Thoughts, comments, or flames? Fire away at zelotes@zealllc.com . Due to my staggering and perpetually increasing e-mail load, I regret that I am not able to respond to comments personally. I will read all messages though and really appreciate your feedback!
Copyright 2000 - 2008 Zeal Research ( www.ZealLLC.com )
Zeal_LLC Archive |
© 2005-2022 http://www.MarketOracle.co.uk - The Market Oracle is a FREE Daily Financial Markets Analysis & Forecasting online publication.


