Why Estonia Is Beating the Eurozone Economy
Economics / Economic Theory Oct 23, 2012 - 11:35 AM GMTBy: Frank_Shostak
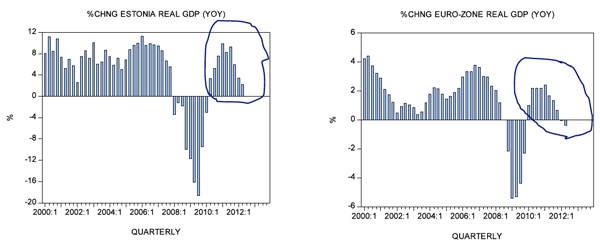
 Against the background of a severe economic crisis in the eurozone, one is surprised to find a member of the euro area that is actually showing good economic performance. This member is Estonia. In terms of so-called real gross domestic product (GDP) the average yearly rate of growth in Estonia stood at 8.4 percent in 2011 against overall eurozone performance of 1.5 percent. So far in 2012 the average yearly growth stood at 2.8 percent in Estonia versus -0.2 percent in the eurozone.
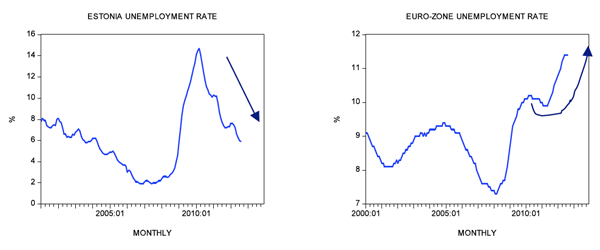
Also note that the unemployment rate in Estonia displays a visible decline: it fell to 5.9 percent in August from 7.6 percent in January. In contrast, the unemployment rate in the eurozone climbed to lofty levels in August. After closing at 10.8 percent in January, the eurozone unemployment rate shot up to 11.4 percent in August.
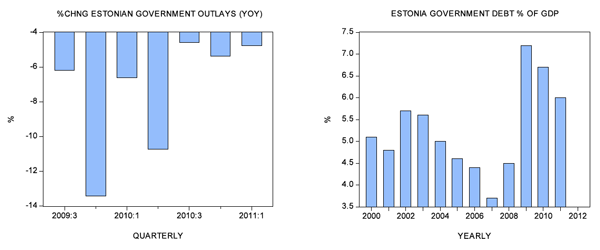
A severe cleansing, i.e., the removal of various nonproductive activities is a key factor behind the success story of Estonia. Between Q3 2009 and Q1 2011 the average yearly rate of growth of government outlays stood at -7.4 percent. In short government outlays were cut sharply. Note that this purged various false activities that emerged on the back of previous loose government spending. Additionally, Estonia's government debt as a percentage of GDP is only 6 percent versus Germany's 81 percent and Greece's 165 percent.
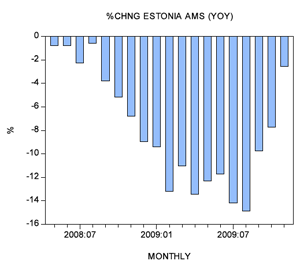
Another important factor that revitalized the Estonian economy is a fall in money supply during the period May 2008 to November 2009, i.e., money supply declined for 19 months. Note that the average of the yearly rate of growth of our monetary measure (AMS) during this period stood at minus 7.9 percent. A fall in money supply arrested the transfer of real wealth from wealth-generating activities to non-wealth-generating activities. This amounts to the strengthening of wealth generators and to a weakening of non-wealth-generating activities. Because of a time lag, the effect of this decline in money supply is still in the system, i.e., it continues to benefit economic fundamentals.
Since Q2 2011 the government has reversed its stance and embarked on massive spending. The average of the yearly rate of growth between Q2 2011 and Q2 2012 stood at a positive figure of 11 percent. (Contrast this with the -7.4 percent during Q3 2009 to Q1 2011.) Furthermore, the yearly rate of growth of money supply has been displaying strong growth. The average of the yearly rate of growth between December 2009 and August 2012 stood at 8 percent. (Contrast this with the figure of -7.9 percent during May 2008 to November 2009.)
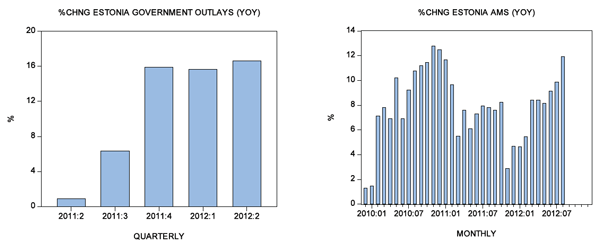
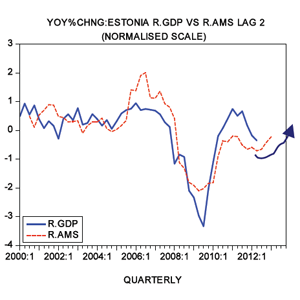
Rather than persisting with the cleansing process, the government and the central bank have chosen to reverse the stance, thereby arresting the process of healing the economy. Temporarily the reversal of the stance is probably going to "work." It will give rise to new bubble activities and will strengthen the old bubble activities. In terms of real GDP, it is quite likely that we are going to see a visible strengthening ahead in its growth momentum. At some stage, however, the weakening of wealth generators is going to be felt and the Estonian economy is going to suffer because of the reversal in its fiscal and monetary stance.
Summary and Conclusions
The Estonian case shows that a policy that removes bubble activities lays the foundation for healthy economic growth.
Any attempt to alter tighter fiscal and monetary policies brings back false, nonproductive activities and leads to an economic impoverishment.
It is not possible to generate something out of nothing.
Any attempt to do so results in an economic disaster.
Frank Shostak is an adjunct scholar of the Mises Institute and a frequent contributor to Mises.org. He is chief economist of M.F. Global. Send him mail. See Frank Shostak's article archives. Comment on the blog.![]()
© 2011 Copyright Frank Shostak - All Rights Reserved Disclaimer: The above is a matter of opinion provided for general information purposes only and is not intended as investment advice. Information and analysis above are derived from sources and utilising methods believed to be reliable, but we cannot accept responsibility for any losses you may incur as a result of this analysis. Individuals should consult with their personal financial advisors.
© 2005-2022 http://www.MarketOracle.co.uk - The Market Oracle is a FREE Daily Financial Markets Analysis & Forecasting online publication.


