


Markets Breaking Supports, Stock Market Waterfall Drop Ahead?
Stock-Markets / Financial Crash Oct 22, 2012 - 07:15 AM GMT

 -- Using the 10-week moving average as support, VIX staged a breakout above its two previous highs. It found resistance at its 40-week moving average, which produced a brief respite late on Friday. Once above the 40-day resistance, VIX has a shot at Cycle Top resistance at 34.07 and possibly much higher.
SPX breaks critical support.
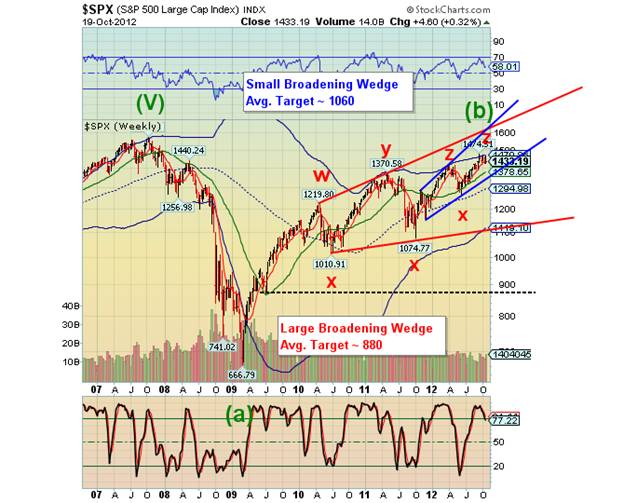
-- SPX retested its Cycle Top resistance at 1470.86 and has now crossed beneath its 10-week moving average at 1436.38. This is where the excitement begins. The next possible support is the 40-week moving average at 1378.65. Most investors are viewing this decline as a normal pullback in a bull market. However the Broadening Top formations suggest the decline may be much faster and deeper than normal. There are four potential Broadening Wedges nested within each other that may cause a “pancake effect” as the decline breaks the supports of these formations, one after another. In addition, the extended rallies are delaying cycle lows that are now long overdue. This could have the effect of compressing an already significant decline into an intense panic situation.
NDX testing its 40-week average.
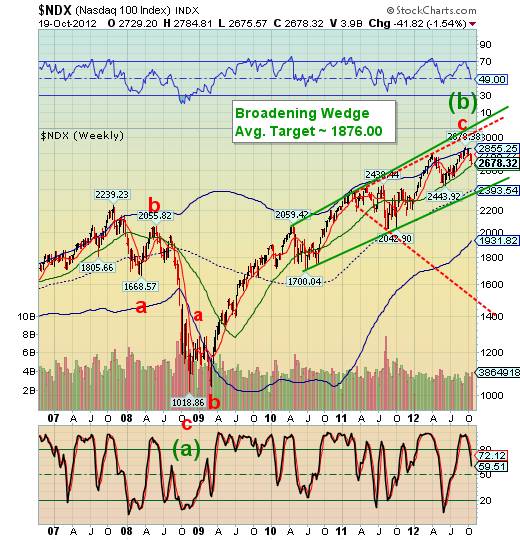
The NDX leads the major indices in their decline by being the first to cross its its 10-week moving average at 2788.22. It is now testing its 40-week moving average at 2658.33. What is more, there are no further supports beneath it until mid-Cycle support at 2393.54, where it has the opportunity of breaking its 2 ½ year old Broadening Wedge at the same time. This Broadening Wedge has an average target below Cycle Bottom support at 1913.42.
(ZeroHedge) Whether its AAPL, GOOG, or the broad equity indices, today saw the bulls 'Baumgartnered'. Despite a valiant attempt to rally into the close, because Bernanke forbid the Dow close the week red, the NASDAQ is 4% off its Wednesday lows (-1.3% on the week) as AAPL suffers its largest 3-week decline since the March 2009 lows (closing with a $609 handle -3.6% today!) and Tech is -5.7% from QEtc.
The Euro is ready to decline again.
-- The Euro completed a reversal pattern as it winds up for its big decline. It is now in one of the most bearish of Elliott Wave counts, a third wave at three degrees. The following week may see a panic decline in the Euro. This is due to a long-overdue Master Cycle low that is expected at any time.
(ZeroHedge) …Spain has essentially three options:
- Spain goes the “Greek route” of agreeing to austerity measures in exchange for bailouts (which will implode the economy).
- Prime Minister Rajoy refuses to impose austerity measures and is removed/ replaced by an EU technocrat who is pro-austerity measures (like Italy experienced last year)
- Spain defaults/ leaves the EU
The US Dollar finds higher support at the trendline.
USD found support at its lower Triangle trendline, just above weekly mid-Cycle support at 78.60. The potential right shoulder of the inverted Head & Shoulders appears finished, with the rally due to begin this week. Because this pattern is not apparent in the daily charts, there is very little awareness of it and the ramifications of a powerful new trend in the Dollar.
Gold closes below its 10-week support.
-- Gold closed beneath its 10-week support at 1730.80 and is due to breach its Orthodox Broadening Top. The implications for gold are enormous, since this is a pre-crash pattern. The pattern calls for a further decline, possibly to its 40-week moving average and a probable retracement back to its 10-week former support turned resistance. The average target for the Broadening Formation is 1324.40, which is very near Cycle Bottom support at 1316.94. Investor sentiment is off the charts, suggesting there has been virtually no preparation for the panic to come. In addition, there is a complex Head & Shoulders neckline awaiting at 1565.00. Could this be the start of something big???
Treasuries between a rock and a hard place.
-- USB has slipped below the lower trendline of its 43-month old Ending Diagonal formation and closed between the 10-week moving average at 147.55 and its 40-week support at 145.39. A break below the 40-week will confirm the new trend. Ending Diagonals are usually completely retraced, suggesting a decline below its 31-year trendline and a target near Cycle Bottom support at 114.35. This forecasts a massive technical breakdown. A further decline may spark the first flash crash in bonds, which nobody is expecting. See below.
(Bloomberg) Treasuries fell, with 10-year note yields rising to a one-month high, as better-than-forecast economic data and optimism that the political will exists to stave off a deeper crisis in Europe trimmed refuge demand…The U.S. will auction $99 billion of notes next week. The Federal Reserve is forecast to maintain its bond-buying stimulus plan at its policy meeting Oct. 24.
Crude confirms a downtrend.
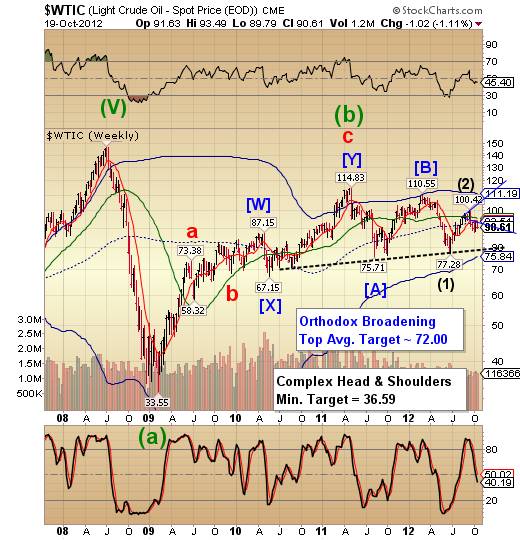
-- West Texas Intermediate Crude retested trendline resistance oof the Orthodox Broadening Top and mid-Cycle resistance at 93.51. The 10-week m.a. crossed below its 40-week m.a in April, creating what is known as a death cross (bearish). The 10-week moving average has not crossed back above, leaving WTIC in a precarious position.
China stocks confirm a bullish breakout, despite economic slowdown.
--The Shanghai index has broken above its Bullish Wedge formation and its 10-week moving average support at 2102, continuing to distance itself from it. Bullish Wedges are short-term consolidation patterns that have a minimum potential of attaining mid-Cycle resistance at 2548.30. If it can break out above that level, the surprise finding is that it may go the distance to Cycle Top resistance at 3123.56. This is a very reliable pattern and worth sitting through some extra volatility while attaining its goal.
(Reuters) - China's power output in September rose 1 .5 percent from a year ago, with the pace of growth cooling to the lowest in three months as a slowing economy dampened electricity demand from industrial users.
Power production in September was 390.7 billion kilowatt-hours (kWh), down 10 percent from August and the lowest since May, data from the statistics bureau showed on Thursday.
Annual growth in power output has slowed markedly from the double-digit rates posted most of last year, as demand from core industrial users in the steel, cement and smelting sectors weakened on the back of China's economic slowdown.
The India Nifty is not recovered from its flash crash. More to follow?
The India Nifty is struggling to maintain its elevation as attempts to reach Cycle Top resistance at 6085.78 have failed. From an Elliott Wave standpoint, the flash crash may be counted as a first wave of III. If so, CNXN may be ready for a crash of major proportions as it moves into Wave [3] of III. .
The Bank Index weakens. A waterfall ahead?
-- Despite its bullish appearance, BKX has not made a new high since September 14, more than a month ago. It remains aboveits 10-week moving average at 49.42 and mid-Cycle support at 46.18, but more troubling earnings revelations may confirm the reversal of trend and a probable flash crash in the week ahead. The efforts of the Fed to re-liquify the banks created a cycle inversion. This “kick the can” mentality on Wall Street only makes the inevitable declines worse. The problem with the banks is insolvency, not illiquidity.
"The Clock Is Running, The Cash Is Almost Gone And Make-Believe Will No Longer Suffice"
(ZeroHedge) “The last summit yielded nothing and worse than nothing because the two camps are worlds apart and sharply divided. They couldn't agree on the banking supervision issue. They have no agreed upon path for Spain, for Greece, for Cyprus, for Ireland or for Portugal. Germany has drawn a line in the concrete concerning legacy sovereign issues, legacy bank issues and Ms. Merkel has stated quite dramatically that Germany will not allow the new ESM to be used for old problems and that the individual nations will have to foot the bill for them. The "Muddle" is over in my opinion and the "Crisis" has now begun. The long, long road of "put it off" has reached its conclusion and there is no agreement and no compromise on how to proceed. We have finally reached the "Danger Zone" and I advise you to note the change!”
We end on that note.
Regards,
Tony
Our Investment Advisor Registration is on the Web
We are in the process of updating our website at www.thepracticalinvestor.com to have more information on our services. Log on and click on Advisor Registration to get more details.
If you are a client or wish to become one, please make an appointment to discuss our investment strategies by calling Connie or Tony at (517) 699-1554, ext 10 or 11. Or e-mail us at tpi@thepracticalinvestor.com .
Anthony M. Cherniawski, President and CIO http://www.thepracticalinvestor.com
As a State Registered Investment Advisor, The Practical Investor (TPI) manages private client investment portfolios using a proprietary investment strategy created by Chief Investment Officer Tony Cherniawski. Throughout 2000-01, when many investors felt the pain of double digit market losses, TPI successfully navigated the choppy investment waters, creating a profit for our private investment clients. With a focus on preserving assets and capitalizing on opportunities, TPI clients benefited greatly from the TPI strategies, allowing them to stay on track with their life goals
Disclaimer: The content in this article is written for educational and informational purposes only. There is no offer or recommendation to buy or sell any security and no information contained here should be interpreted or construed as investment advice. Do you own due diligence as the information in this article is the opinion of Anthony M. Cherniawski and subject to change without notice.
Anthony M. Cherniawski Archive |
© 2005-2022 http://www.MarketOracle.co.uk - The Market Oracle is a FREE Daily Financial Markets Analysis & Forecasting online publication.