


Examining the Case For And Against Gold
Commodities / Gold and Silver 2012 Oct 21, 2012 - 05:13 AM GMTBy: Clif_Droke

 Since being shunned by traders last year after a series of margin increases, gold has enjoyed a worthy comeback since turning around this summer. The yellow metal rallied from a yearly low of $1,540 to a recent high of nearly $1,800. All in all, not a bad performance in just over an eight week period.
Analysts and investors are divided as to what was the impetus behind the late summer rally for gold. Was it fear of a European-led global economic recession? A slowdown in China? An anticipation of loose central bank monetary policy? The reasons behind the rally are debatable but the gains gold has made since July aren't.
We were gratified to have ridden the rally in its entirety by purchasing a position in the iShares Gold Trust (IAU) in early August and standing pat until the 15-day moving average was recently violated on a closing basis. It's not often that a 15-day MA buy signal yields such extraordinary gains over a 2-month period with barely any significant volatility or "whipsaws" (i.e. no violation of the 15-day MA along the way). This summer's rally in gold and the gold ETF was indeed a memorable and profitable one.
It's time, however, to start asking some hard questions about the continued strength of the yellow metal in the near term, as well as addressing the possibility (though I don't say probability) that gold may have reached a temporary plateau which could last several weeks. To this end, let's examine the evidence both for and against a continued bullish outlook for gold.
The first piece of technical evidence weighing against a continued gold rally (in the near term) is the relative strength indicator for gold. This indicator compares the daily gold price with the daily closing value of the benchmark S&P 500 stock market index. The implication behind the gold relative strength indicator is that "smart money" traders and investors are expected to allocate the bulk of their money into whichever of the two assets - equities and gold - are in a position of relative strength. The gold relative strength chart is quite revealing. As you can see here, the chart has been making a series of lower peaks since January and hasn't confirmed the recent gold rally.
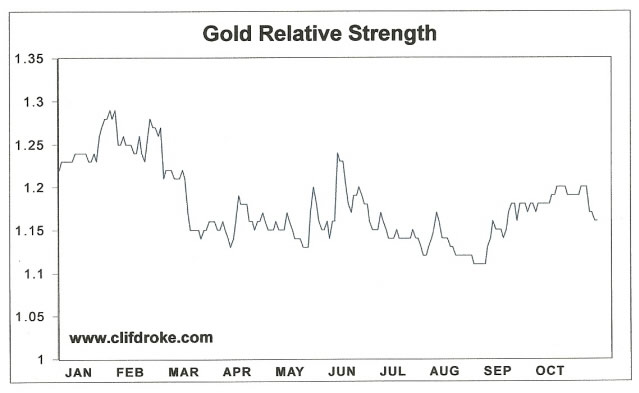
A caveat is in order here. Although the relative strength indicator proved to be an invaluable guide to keeping traders out of the gold market when gold last peaked earlier this year in February, in a liquidity-fueled bull market technical indicators aren't always reliable. A market which is being fed mainly by a loose central bank monetary policy - in this case the Fed's QE3 program - can ignore negative divergences in the various technical indicators, sometimes for weeks or even months at a time. This has apparently been the case with the gold relative strength indicator since August.
My assessment of this indicator is that short-term and intermediate-term gold investors who haven't done so should take some profits and raise stop losses on remaining long positions. I also don't recommend adding to long positions at this time (although we may soon have another opportunity to do so if gold confirms another immediate-term buy signal per the rules of the 15-day MA trading system). It's possible that gold will continue ignoring the negative technical divergence in the relative strength indicator. It's equally possible, however, that until relative strength improves gold will languish in a trading range for a while. Traders should be prepared for either possibility and not allow greed to overcome their better judgment.
Another point of concern is that investors' enthusiasm for the yellow metal has reached levels which in past bull markets have been considered frothy and suggestive of an interim top. Austin Kiddle of Sharps Pixley recently observed, "Gold price sentiment has continued to surge - traders have made the biggest bets on gold rally since seven months ago, the gold-backed ETP holdings have reached another record high at 2,565 metric tons while UBS has recently seen Indian physical gold sales rise the most since April." Seven months ago was when gold last reached a major interim top and just prior to a three-month decline.
A pure contrarian would look at the current investor sentiment on gold and conclude that gold has reached another major interim top. It's important to remember, however, that in a bull market temporary spikes in investor enthusiasm, while they can produce short-term tops, are quickly "corrected" and instead of producing major declines often produce new buying opportunities. Indeed, a correction is already underway for the gold price but it could soon be stopped not far from current levels. If gold is indeed in an interim bull market then the current decline should definitely reverse without retracing all of the July-October rally.
A final consideration is in order as we examine the case for and against a continuation of the gold rally. Earlier this summer we looked at the important 10-month price oscillator for gold and saw that it was flashing an historic "oversold" reading. This implied that a potentially major bull market leg would occur in the near future. This of course was fulfilled, at least in part, during the late summer rally. As of October, the 10-month oscillator has rebounded rather sharply from its previous "oversold" reading, yet it also remains well below the bearish "red zone" as you can see here.
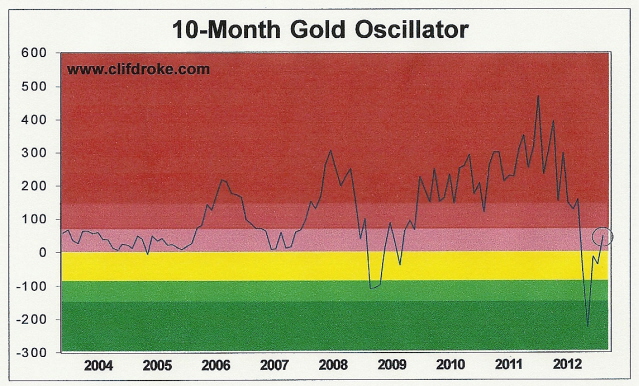
Historically, when the oscillator curls up from an oversold reading the gold price typically remains in an overall upward trend for several months (usually around 6-9 months) thereafter and normally doesn't top out until the indicator registers a decisively "overbought" reading. That hasn't happened yet, so the odds technically favor a continuation of the intermediate-term bull market after the correction now underway was run its course.
2014: America's Date With Destiny
Take a journey into the future with me as we discover what the future may unfold in the fateful period leading up to - and following - the 120-year cycle bottom in late 2014.
Picking up where I left off in my previous work, The Stock Market Cycles, I expand on the Kress cycle narrative and explain how the 120-year Mega cycle influences the market, the economy and other aspects of American life and culture. My latest book, 2014: America's Date With Destiny, examines the most vital issues facing America and the global economy in the 2-3 years ahead.
The new book explains that the credit crisis of 2008 was merely the prelude in an intensifying global credit storm. If the basis for my prediction continue true to form - namely the long-term Kress cycles - the worst part of the crisis lies ahead in the years 2013-2014. The book is now available for sale at: http://www.clifdroke.com/books/destiny.html
Order today to receive your autographed copy and a FREE 1-month trial subscription to the Gold & Silver Stock Report newsletter. Published twice each week, the newsletter uses the method described in this book for making profitable trades among the actively traded gold mining shares.
By Clif Droke
www.clifdroke.com
Clif Droke is the editor of the daily Gold & Silver Stock Report. Published daily since 2002, the report provides forecasts and analysis of the leading gold, silver, uranium and energy stocks from a short-term technical standpoint. He is also the author of numerous books, including 'How to Read Chart Patterns for Greater Profits.' For more information visit www.clifdroke.com
Clif Droke Archive |
© 2005-2022 http://www.MarketOracle.co.uk - The Market Oracle is a FREE Daily Financial Markets Analysis & Forecasting online publication.