U.S. Dollar, Bonds, Gold, Commodities, and Stocks October Trend Forecasts
News_Letter / Financial Markets 2012 Oct 20, 2012 - 07:59 PM GMTBy: NewsLetter
 The Market Oracle Newsletter
October 5th , 2012 Issue #15 Vol. 6
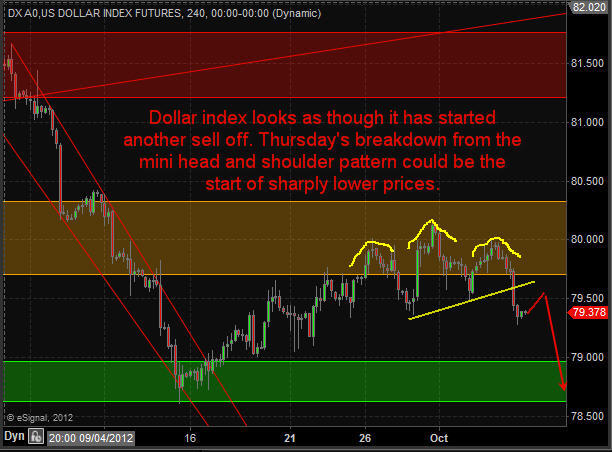
U.S. Dollar, Bonds, Gold, Commodities, and Stocks October Trend ForecastsBy Chris Vermeulen: Over the past year we have had some really interesting things unfold in the market. Investing or even swing trading has been much more difficult because of all the wild economic data and daily headline news from all over the globe causing strong surges or sell offs almost every week. For a while there you could not hold a position for more than a week without some type of news event moving the market enough to either push you deep in the money or get stopped out for a loss. This has unfortunately caused a lot of individuals to give up on trading which is not a good sign for the financial market as a whole. The key to navigating stocks which everyone thinks are overbought is to trade small position sizes and focus on the shorter time frames like the 4 hour charts. This chart is my secret weapon and giving you both large price swings which daily chart traders focus on while also showing clear intraday patterns to spot reversals or continuation patterns with precise entry/exit points. While I could ramble on about why the stock market is primed for major long term growth from this point forward I will keep things short and simple with some 4 hour and daily charts for you to see what I see and what I am thinking should unfold moving forward. Keep in mind, the most accurate trading opportunities that happen week after week are the quick shifts in sentiment which only last 2-5 days at most which is what most of my charts below are focusing on… Dollar Index – 4 Hour Chart This chart shows a mini Head & Shoulders reversal pattern and likely target over the next five sessions. The dollar index has been driving the market for the past couple years so a lower dollar means higher stock and commodity prices.
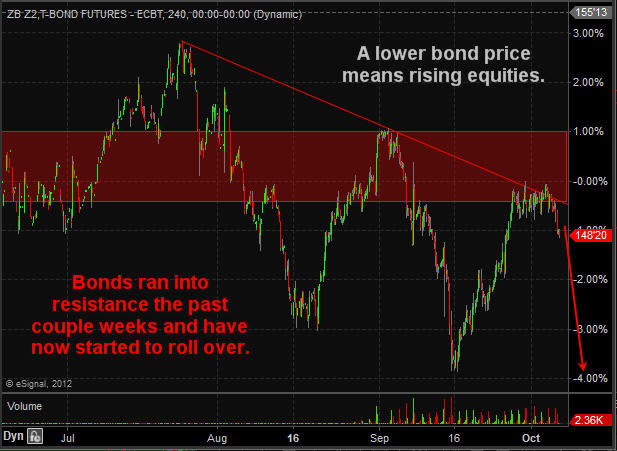
Bond Futures – 4 Hour Chart Money has been flowing into bonds for the past couple weeks with most traders and investors expecting a strong correction in stocks. As you can see the price of bonds hit resistance this week and as of Thursday has now started selling off. Money flowing out of this “Risk Off” asset means money will move to the “Risk On” investments like stocks and commodities.
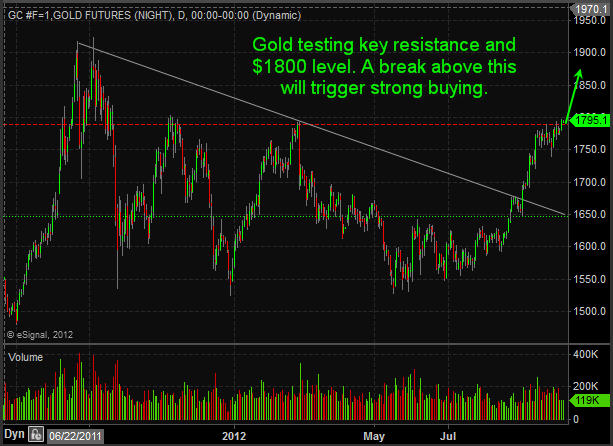
Gold Futures – Daily Chart Gold is stuck in both categories in my opinion. It is a “Risk Off” safe haven when people are scared of falling stock prices, and it is also a “Risk On” speculative investment when people are feeling good about the market. Gold has been trading at key resistance for a couple weeks and looks as though it’s starting its next rally.
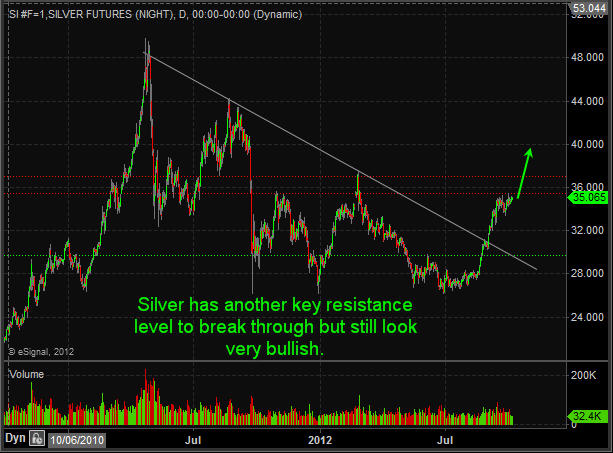
Silver Futures – Daily Chart Silver is in the same boat as gold though it carries much more volatility than gold. Expect 2-4% swings regularly and sloppy chart patterns in this metal.
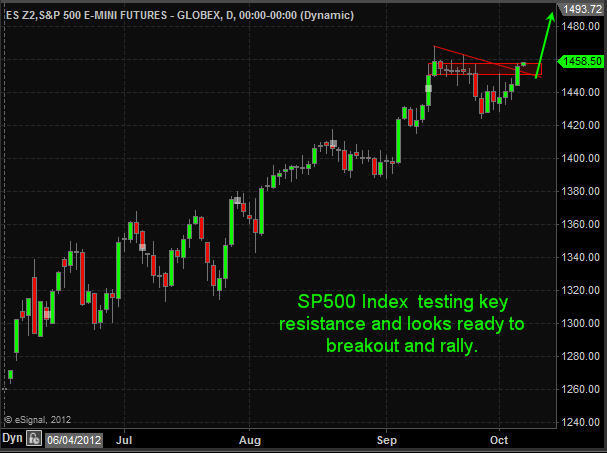
SP500 Futures – Daily Chart As much as everyone hates to buy stocks up at these lofty prices I hate to say it but I think they are going to keep going up and they could do this for a long time yet. If the dollar index continues to break down then I expect the SP500 to rally another 3% from here (1500) in the next 1-2 weeks.
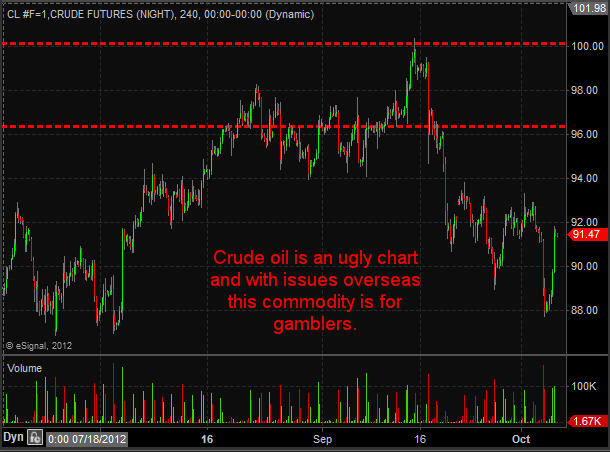
Crude Oil Futures – 4 Hour Chart Crude oil has not had much attention from me in the past few months. While it has had big price action many of those big days took place on news causing an instant price movement making this extra dangerous to trade. I continue to watch rather than get attached to it.
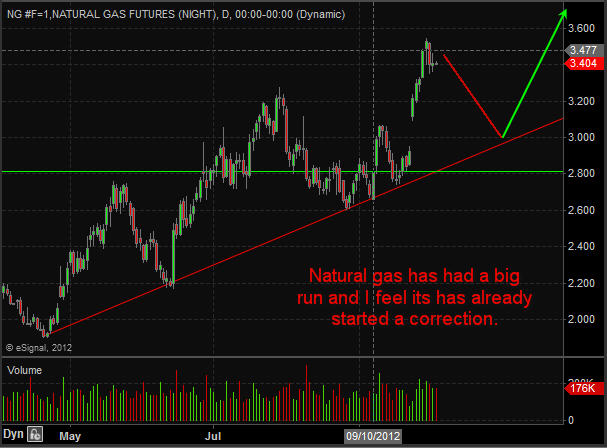
Natural Gas Futures – Daily Chart Natural gas has been a great performer for us in the past 6 months as all the short positions slowly get covered. I just closed out my natural gas ETF trade this week with a 31.9% gain and plan on getting back in once the chart provides another low risk setup.
Trading Conclusion: In short, I feel the dollar index along with bonds will correct over the next few weeks. That will trigger buying in stocks and commodities. Keep in mind natural gas dances to its own drum beat. The dollar does not have much affect on its price and most times natural gas is doing the opposite of the broad market. Get My Pre-Market Trading Analysis Video and Intraday Chart Analysis EVERY DAY – www.TheGoldAndOilGuy.com Chris Vermeulen Please visit my website for more information. http://www.TheGoldAndOilGuy.com Chris Vermeulen is Founder of the popular trading site TheGoldAndOilGuy.com. There he shares his highly successful, low-risk trading method. For 7 years Chris has been a leader in teaching others to skillfully trade in gold, oil, and silver in both bull and bear markets. Subscribers to his service depend on Chris' uniquely consistent investment opportunities that carry exceptionally low risk and high return. This article is intended solely for information purposes. The opinions are those of the author only. Please conduct further research and consult your financial advisor before making any investment/trading decision. No responsibility can be accepted for losses that may result as a consequence of trading on the basis of this analysis.
You're receiving this Email because you've registered with our website. How to Subscribe Click here to register and get our FREE Newsletter To access the Newsletter archive this link Forward a Message to Someone [FORWARD] To update your preferences [PREFERENCES] How to Unsubscribe - [UNSUBSCRIBE]
The Market Oracle is a FREE Financial Markets Forecasting & Analysis Newsletter and online publication. |
|||||||||||||
© 2005-2022 http://www.MarketOracle.co.uk - The Market Oracle is a FREE Daily Financial Markets Analysis & Forecasting online publication.


