


America's Gold Run, Huge Deficit as Record Gold Exported Abroad
Commodities / Gold and Silver 2012 Oct 16, 2012 - 01:17 PM GMTBy: Steve_St_Angelo

 In a stunning development over the first seven months of the year, the United States has run up a huge gold deficit as it has exported a record 424 metric tonnes of gold. This is indeed a significant amount when the U.S. exported a total of 488 metric tonnes for the entire year in 2011.
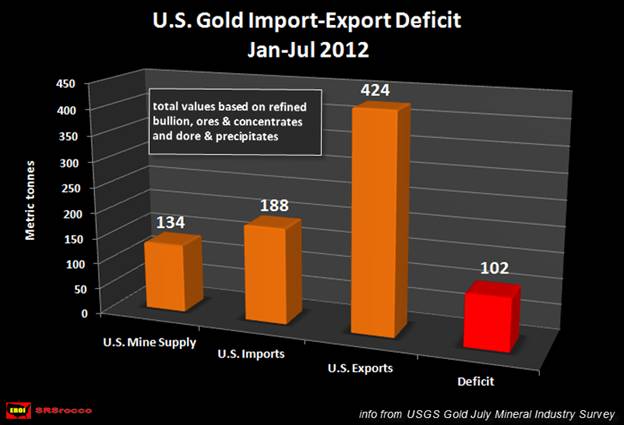
According to the USGS July Gold Mineral Industry Survey, the U.S. only imported 188 metric tonnes of gold between Jan-Jul, but exported 424 metric tonnes leaving a huge shortfall. Some of this deficit was made up by the U.S. domestic gold mine supply.
However, if we add up all the domestic gold mine supply plus the gold imports in the first seven months of 2012, the United States still ran a large 102 metric tonne gold account deficit.
The U.S. produced 134 metric tonnes of gold between January & July of 2012:
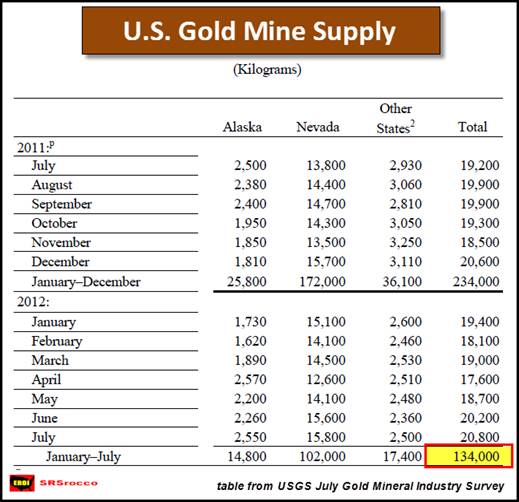
NOTE: the figures are shown in kg. or kilograms. We convert them to metric tonnes (MT) by dividing by 1,000.
As we can see from the table above (source USGS), of the total 134 metric tonnes of gold produced in the country, Nevada supplied 102 metric tonnes or 76% of the overall amount. Alaska was second by producing 14.8 metric tonnes or 11% of the U.S. production.
If we add all the U.S. gold mine supply between Jan-Jul (134 MT), plus all the gold imports (188 MT) we get total of 322 metric tonnes. However, the United States exported 424 metric tonnes of gold during the same period leaving a huge 102 metric tonne deficit:
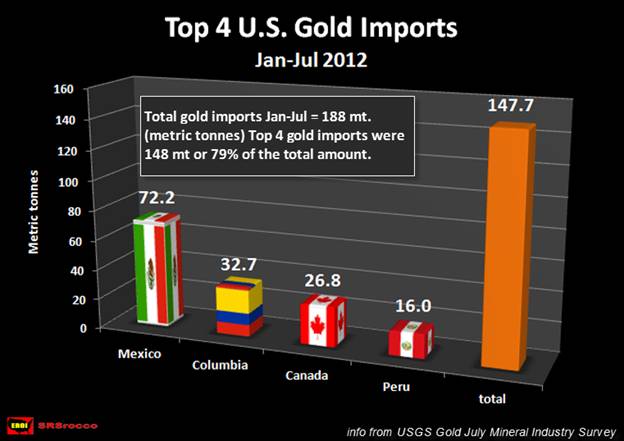
To get an idea of where the United States imports the king monetary metal, I put together a graph showing the top 4 countries who supplied the country the majority of its gold. When the U.S. imports gold, it predominantly acquires it in the form of dore & precipitates, but exports it in a larger degree as refined bullion.
Here we can see that the U.S. imports the most of its gold from its closest southern neighbor, Mexico (72.2 MT), followed by Columbia (32.7 MT), Canada (26.8 MT) and lastly Peru (16 MT). These four countries accounted for nearly 148 metric tonnes of the total 188 metric tonnes imported into the U.S. in the first seven months of the year. Other countries who exported smaller amounts of gold to the U.S. (but are the top suppliers of the remaining bunch), are Bolivia, Curacao, Guatemala, and Guyana.
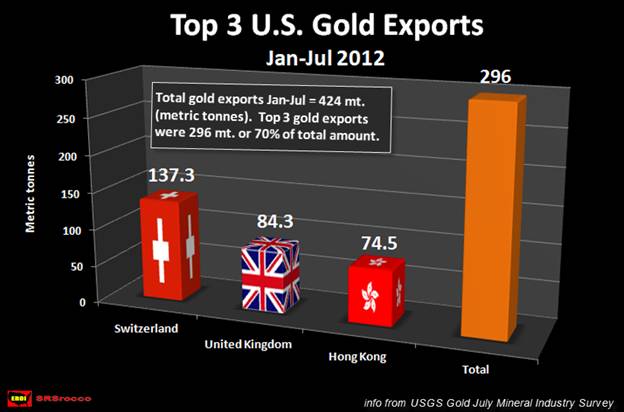
As was stated in the headline of this article, the United States is exporting a record amount of gold and the majority of it is being sent to Switzerland, London and Hong Kong. I would imagine these large U.S. gold exports are being used to try and fill the insatiable demand by the Eastern buyers (mostly Asian)... claimed by Jim Willie (goldenjackass.com) in many of his recent interviews.
Switzerland received the lion's share of the gold importing 137.3 MT of gold from the U.S., while the U.K. came in second at 84.3 MT, followed by Hong Kong at 74.5 MT. These three countries imported 296 MT of gold between Jan-Jul of this year. This was 70% of all the gold (424 MT) exported from the United States during this time. Some of the countries who received the larger share of the remaining 30% of gold from the United States were Australia, Canada, India and Thailand.
Just to make sure I don't cause any confusion, these figures are based on the USGS statistics of gold import-exports of the following categories:
1) ores & concentrates
2) dore & precipitates
3) refined bullion
I did not include any of the fabricated gold statistics that include waste & scrap, metal powder, and gold compounds. Even though there is additional gold in these fabricated categories, the more notable and important movement of gold is found in refined bullion and dore & precipitates.
I would also like to clarify that gold recycling and gold scrap was not factored into the 102 metric tonne gold deficit.... which stands at nearly 3.3 million ounces. The amount of metal coming into the U.S. market from these two sources could be significant.
Furthermore, these are only "OFFICIAL FIGURES". We have no idea of the "TRUE UNOFFICIAL AMOUNT" of gold leaving the country from allocated accounts as stated by Jim Willie's source in Europe.
That being said, as more gold leaves the shores of the U.S. than is either imported or supplied from its domestic mines, the deficit will continue to grow.
Steve St .Angelo Independent researcher residing in southwest Utah
Contact SRSrocco@gmail.com
© 2012 Copyright Steve St .Angelo - All Rights Reserved Disclaimer: The above is a matter of opinion provided for general information purposes only and is not intended as investment advice. Information and analysis above are derived from sources and utilising methods believed to be reliable, but we cannot accept responsibility for any losses you may incur as a result of this analysis. Individuals should consult with their personal financial advisors.
© 2005-2022 http://www.MarketOracle.co.uk - The Market Oracle is a FREE Daily Financial Markets Analysis & Forecasting online publication.