High U.S. Unemployment Rate, Obama Failure or Bush Catastrophe for Romney to Continue?
ElectionOracle / US Presidential Election 2012 Oct 06, 2012 - 01:11 AM GMTBy: Nadeem_Walayat
 Democrats and republican have been busy putting their own spin on the latest unemployment data released by the BLS which shows that the US unemployment rate fell below 8% for the first time in 45 months by falling 0.3% to 7.8% for September 2012, down from a high of 10% reached in October 2009.
Amidst an election frenzy, both parties and candidates have jumped on the data to their advantage.
Romney called it a jobs crisis -"By any rational measure, it's crystal clear we're in the middle of a jobs crisis", "My priority is jobs. And from Day One of my presidency, I will lead us out of this crisis."
Obama said the 114,000 new jobs in September, coupled with the drop in unemployment, was "a reminder that this country has come too far to turn back now.", "We've made too much progress to return to the policies that caused this crisis in the first place."
The Truth About the U.S. Unemployment Rate
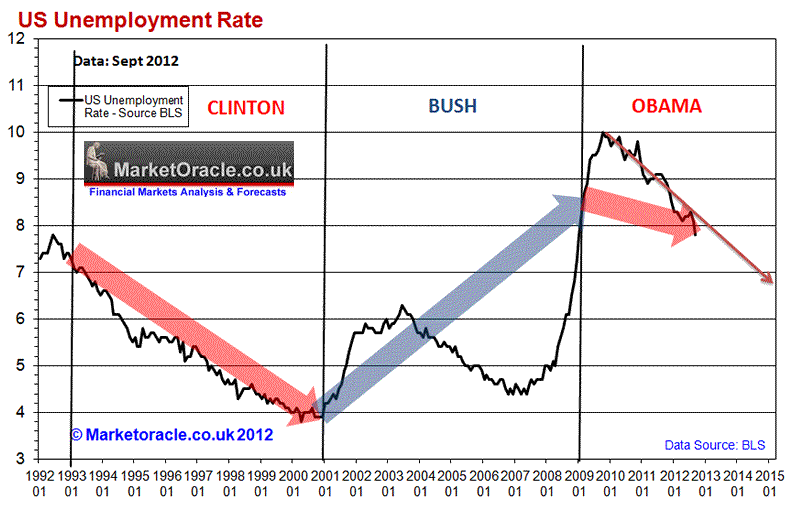
In sticking to the official standardised statistics produced by the BLS rather any of the political motivated statistics found around the net, the below graph illustrates the trend in the unemployment rate from 1992 to the present in terms of Presidency.
US Unemployment Rate Facts
Clinton - Unemployment Rate fell from 7.2% to 4.2% - 3%
Bush -Unemployment rate rose from 4.2% to 8.3% +4.1%
Obama - Unemployment rate to date has fallen from 8.3% to 7.8% -0.5%
The data clearly illustrates the extent to which the Bush presidency was a catastrophe for America as Bush handed Obama an economy that was literally in a state of free-fall, the consequences of which were that it took Obama some 10 months to bring the rate of free fall to a halt, with the subsequent recovery at a very similar rate of decent as that under the Clinton Presidency which suggests, should the trend continue than the U.S. unemployment rate should fall to about 6.5% by the time of the 2016 election.
On the other hand all Mitt Romney has to point to is the track record of GW Bush, which would imply a further catastrophe sending the US unemployment rate soaring towards 13%, which explains the complete denial that the Republicans have been in where effectively the economic and financial world stated on 1st of January 2009, with zero acknowledgement of the Bush catastrophe.
Historic Record
A further look at the historic unemployment rates amongst previous Presidents shows that there is a clear tendency for Republican Presidencies to push up unemployment rates whilst Democrat Presidencies tend to cut the unemployment rates.
Therefore in all probability if Romney does win the election then US unemployment will be higher than where it is today (10%?) and were Obama reelected the unemployment rate will be lower than where it is today with the trend suggesting it could fall to around 6.5%.
The Truth About the Real U.S. Unemployment Rate
Many republican's such as Donald Trump have been busy pointing out that the real US unemployment rate is as high as double the official rate with figures typically offered ranging from 11% to 20%.
So what is the truth about the real US unemployment rate ?
The actual total US unemployment rate referred to as U-6 stands at 14.7%, so many republicans are correct in claiming that the real rate of US unemployment is far higher than the official rate as the official rate only includes those that are actively seeking work. This figure does not include the unemployed who are not actively looking for work; nor does it factor in workers with part-time jobs who are seeking full-time employment. When these workers are included, the (U-6) un/underemployment rate nearly doubles to 14.7% that remains unchanged from the August figure.
Now before republican run with this figure they need to take a look at the bottom graph that shows all Presidents utilise this trick to under report the true level of unemployment. The only way to gauge the level of corruption of the unemployment statistics is by taking a look at the official rate of unemployment relative to total rate of unemployment in percentage terms, where the lower the percentage the greater the level of corruption.
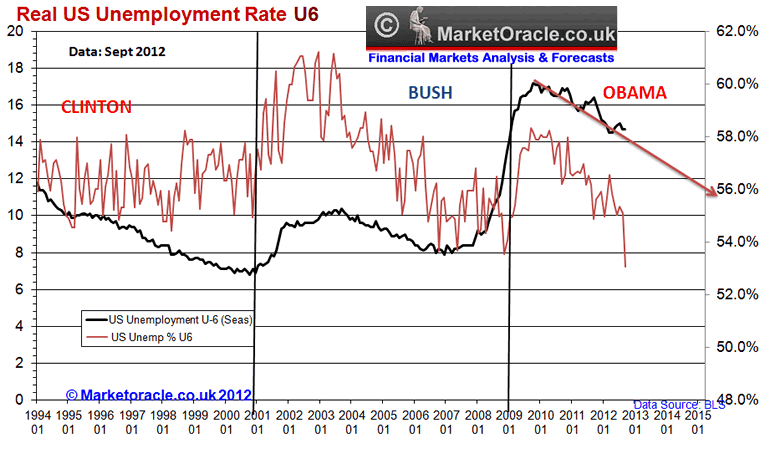
An analysis of the rate of corruption suggests that
a. the Bush regime during the last 3 years of it's Presidency was engaged in maximising the level of corruption in the official unemployment statistics.
b. That the Obama regime official statistics have in the lead up to the 2012 Election increasingly become more corrupt with the final statistics on par with that of the Bush regimes efforts in the lead up to the November 2008 election.
Therefore whilst the real rate of unemployment is reducing as both graphs exhibit a downtrend, the actual extent of the fall in unemployment is far less than the official statistics suggests, which luckily for Obama is that which most of the general population focuses upon.
Obama Heading for Strong Election Win?
Many in the mainstream (New York Times) are running with the fact that no sitting president has ever been re-elected with an unemployment rate at above 7.2%. However what the mainstream press fail to appreciate is that the actual rate is no where near as important as the TREND in unemployment. Therefore the press are again focusing on a red herring that they will only realise after the event, after the election because the 3 year long falling trend in unemployment is on par to that which delivered Bill Clinton a landslide victory in 1996, which suggests that the gap between Obama and Romney is far greater than that which the opinion polls imply. Therefore many american's may be surprised on election night when the results start coming in that point to a relatively strong Obama election win of more than 300 Electoral votes.
The bottom line: the official September unemployment rate of 7.2% will have an important impact on voters as it has succeeded in confirming a continuing down trend in the minds of voters, whereas had unemployment risen by 0.3% then that would have sown doubts that republicans have been fighting desperately to instill.
The reality is that the September 2012 report is highly suspect, where the comparison against U6 does suggest it has been manipulated for electioneering purposes i.e. not by the BLS but via government policy to aim to mask real unemployment. This also suggests that following the election, probability favours a rising US unemployment trend into mid 2013 as the government measures to mask real unemployment unwind.
Source and comments: http://www.marketoracle.co.uk/Article36880.html
By Nadeem Walayat
Copyright © 2005-2012 Marketoracle.co.uk (Market Oracle Ltd). All rights reserved.
Nadeem Walayat has over 25 years experience of trading derivatives, portfolio management and analysing the financial markets, including one of few who both anticipated and Beat the 1987 Crash. Nadeem's forward looking analysis focuses on UK inflation, economy, interest rates and housing market. He is the author of three ebook's - The Inflation Mega-Trend; The Interest Rate Mega-Trend and The Stocks Stealth Bull Market Update 2011 that can be downloaded for Free.
Nadeem is the Editor of The Market Oracle, a FREE Daily Financial Markets Analysis & Forecasting online publication that presents in-depth analysis from over 600 experienced analysts on a range of views of the probable direction of the financial markets, thus enabling our readers to arrive at an informed opinion on future market direction. http://www.marketoracle.co.uk
Disclaimer: The above is a matter of opinion provided for general information purposes only and is not intended as investment advice. Information and analysis above are derived from sources and utilising methods believed to be reliable, but we cannot accept responsibility for any trading losses you may incur as a result of this analysis. Individuals should consult with their personal financial advisors before engaging in any trading activities.
Nadeem Walayat Archive |
© 2005-2022 http://www.MarketOracle.co.uk - The Market Oracle is a FREE Daily Financial Markets Analysis & Forecasting online publication.


