Tracking World Hyperinflation - The Data from Argentina to Zimbabwe
Economics / HyperInflation Oct 04, 2012 - 03:19 PM GMTBy: Submissions
 Steve H. Hanke writes: Hyperinflation is an economic malady that arises under extreme conditions: war, political
mismanagement, the transition from a command to market-based economy. There
are barriers to the recording and publication of reliable inflation statistics. Overcoming
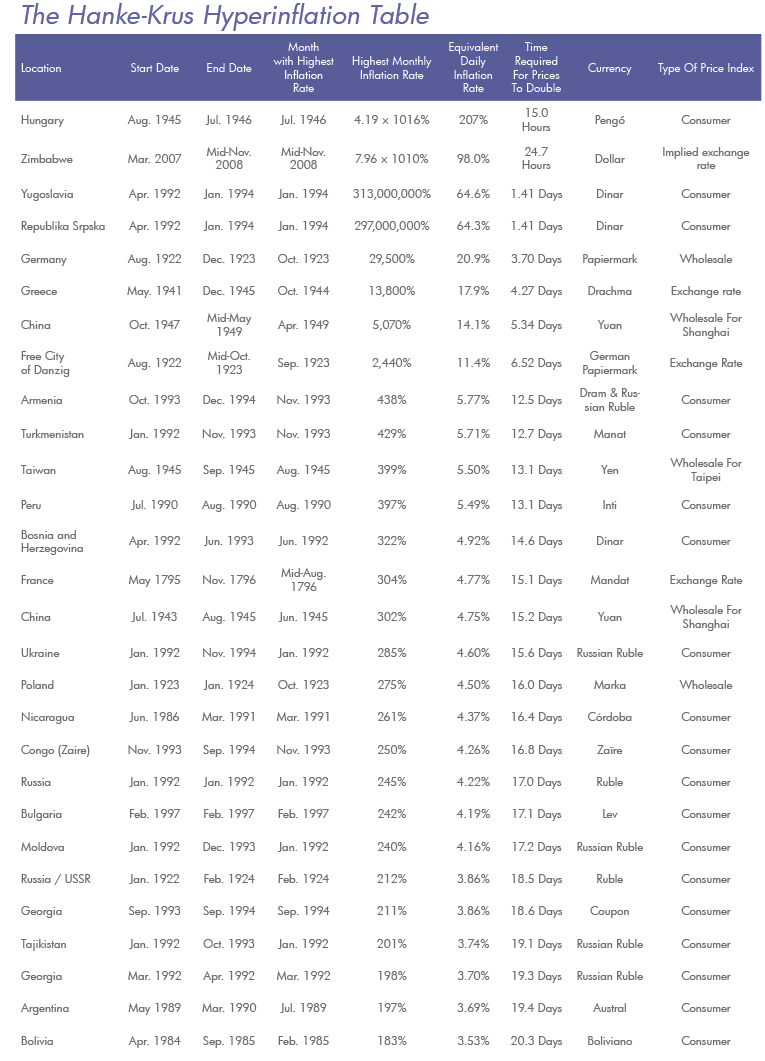
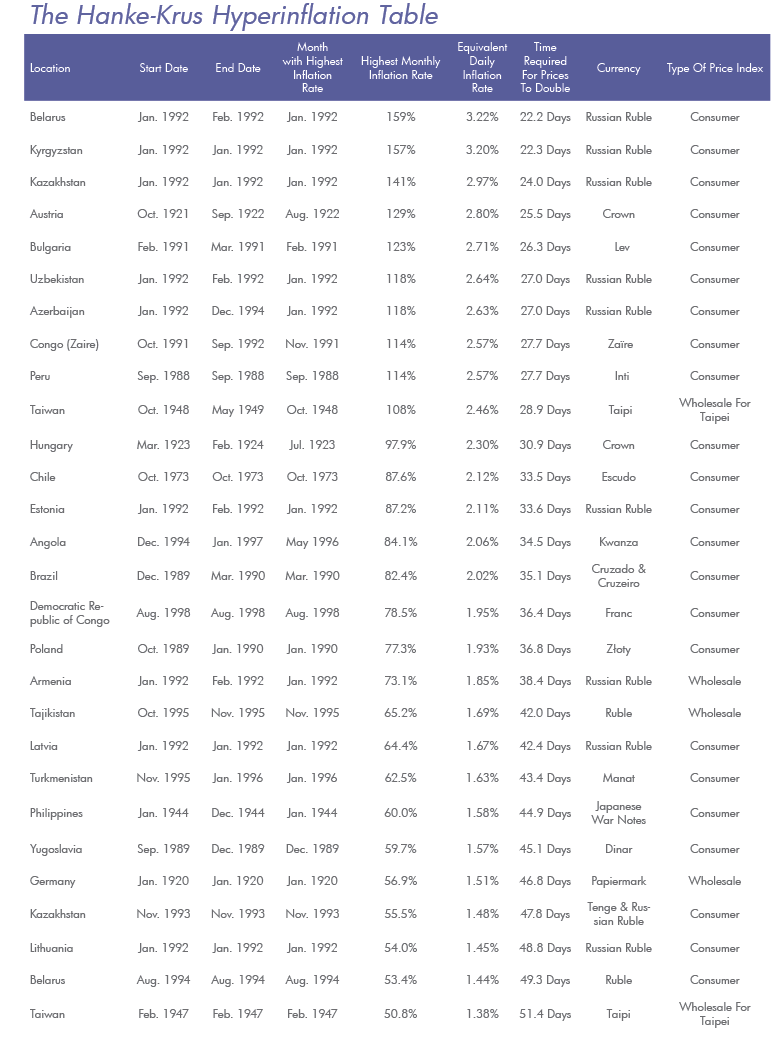
these barriers is an arduous and painstaking process. This article and attached table – an
abbreviated version of a Cato Working Paper – supply, for the first time, data on all 56
episodes of hyperinflation, including several which had previously gone unreported.
The literature on hyperinflation is replete with ad hoc definitions, vague, ill-defined terminology, and a lack of concern for clear, uniform metrics. We attempted to fill the void.
The Hyperinflation Table is compiled in a systematic and uniform way. It utilises clean and consistent inflation metrics, indicates the start and end dates of each episode, identifies the month of peak hyperinflation, and signifies the currency that was in circulation, as well as the method used to calculate inflation rates. We soon learned why no such table exists. We frequently found leads suggesting new episodes, only to discover that the proper documentation of their source was lacking. Even in cases in which we thought replication would be straightforward, it was not.
The former Soviet bloc countries were a particular source of frustration. The data had seemingly been lost in time. After scouring the Library of Congress and the Joint World Bank-IMF Library, as well as a variety of online databases, we finally came across a series of World Bank publications that ostensibly contained the requisite information. But, much of the data were not presented in a usable form. The challenges we faced with the Soviet Bloc were compounded as we looked to the Balkan States and began to investigate hyperinflation episodes of the 1990s. Bosnia and Herzegovina and the Republika Srpska posed the most difficult problems.
In another case, we were able to overcome data deficiencies in a different way. We knew that the Free City of Danzig engineered a currency reform in 1923, following inflationary developments similar to those that had visited Germany. Suspecting that this currency reform was enacted in response to a case of hyperinflation, we were forced to employ creative methods to estimate Danzig’s inflation rate, using purchasing power parity (PPP) to overcome the obstacle.
One 'missing' case was easier to find. We discovered the data for the Democratic Republic of Congo’s August 1998 hyperinflation using the IMF’s International Financial Statistics database. Another largely unreported hyperinflation episode occurred in the Philippines. In 1942, during its occupation of what was then the Commonwealth of the Philippines, Japan replaced the Philippine peso with Japanese war notes. Over-issuance of these notes, dubbed ‘Mickey Mouse money’, resulted in a hyperinflation that peaked in January 1944. The US Army added a small amount of fuel to the Philippine hyperinflation fire by distributing counterfeit Japanese war notes to Philippine guerilla troops.
One of the biggest problems encountered when discussing hyperinflation is the extreme size of the monthly inflation rates. For example, in July 1946, Hungary had a monthly inflation rate of 4.19 × 10¹⁶ %. We included two metrics that help put hyperinflation into perspective: the equivalent daily inflation rate and the time required for prices to double. After years of disorder in the study of hyperinflation, we can now, with The Hyperinflation Table, finally let the data speak for themselves.


This article and the table on p. 11-12 represent an abbreviated version of "World Hyperinflations, a Cato Working Paper" by Steve H. Hanke and Nicholas Krus, August 2012, available from Cato Institute, 1000 Massachusetts Avenue, N.W.Washington, D.C. 20001. Their working paper is available at http:// tinyurl.com/worldhyperinflations. Steve H. Hanke and Nicholas Krus are respectively Professor of Applied Economics at The Johns Hopkins University and research associate at the Johns Hopkins Institute for Applied Economics, Global Health, and the Study of Business Enterprise. Contact: hanke@jhu.edu.
By Steve H. Hanke and Nicholas Krus
www.cato.org/people/hanke.html
Steve H. Hanke is a Professor of Applied Economics and Co-Director of the Institute for Applied Economics, Global Health, and the Study of Business Enterprise at The Johns Hopkins University in Baltimore. Prof. Hanke is also a Senior Fellow at the Cato Institute in Washington, D.C.; a Distinguished Professor at the Universitas Pelita Harapan in Jakarta, Indonesia; a Senior Advisor at the Renmin University of China’s International Monetary Research Institute in Beijing; a Special Counselor to the Center for Financial Stability in New York; a member of the National Bank of Kuwait’s International Advisory Board (chaired by Sir John Major); a member of the Financial Advisory Council of the United Arab Emirates; and a contributing editor at Globe Asia Magazine.
Copyright © 2012 Steve H. Hanke - All Rights Reserved Disclaimer: The above is a matter of opinion provided for general information purposes only and is not intended as investment advice. Information and analysis above are derived from sources and utilising methods believed to be reliable, but we cannot accept responsibility for any losses you may incur as a result of this analysis. Individuals should consult with their personal financial advisors.
© 2005-2022 http://www.MarketOracle.co.uk - The Market Oracle is a FREE Daily Financial Markets Analysis & Forecasting online publication.


