Commodity Stocks Investing: Improving Returns With No Extra Volatility
Commodities / Commodities Trading Oct 02, 2012 - 03:40 AM GMTBy: Frank_Holmes
 Commodities are the necessary building blocks of the world. Glance around you--commodities are what the world needs to live and prosper and are everywhere you look. The world's seven billion people need resources, and that's why we recommend investors consistently allocate a portion of their portfolio to a natural resources investment.
Not every investment is the same, though. Even within the commodities space, when looking at measures such as correlation, performance and risk, two indexes can have very different effects on a portfolio's results.
Take two popular commodity-related indices for example, the Dow Jones-UBS Commodity Index (DJUBS) and the Morgan Stanley Commodity Related Index (CRX).
The DJUBS is made of futures contracts on various physical commodities that represent major commodity sectors such as agriculture, energy, grains, metals, livestock and precious metals. Basically, futures are contracts between a buyer and seller, where the buyer agrees to purchase a specific commodity for a specific price and specific time in the future.
The CRX is comprised of stocks involved in commodity related industries, such as energy, non-ferrous metals, agriculture and forest products.
Yet, while both indices are diversified across various commodities, their correlations to the overall market differ.

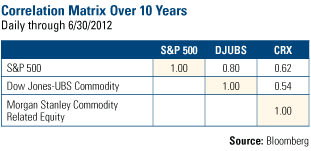
Take a look at the matrix looking at 10 years of data. The table lists the S&P 500 Index, which represents the overall U.S. stock market, and the two commodity indices. When two asset classes or investments are perfectly correlated to each other, their performance moves are in sync and they have a correlation of 1; 0 means that the two investments have no correlation to each other.
Over the past decade through June 30, 2012, you can see the DJUBS and the S&P 500 have had a correlation of 0.80. The CRX and the S&P 500 had a correlation of 0.62. This means the CRX is less correlated to the overall market than the DJUBS.
And why is a low correlation beneficial? In a diversified portfolio, it can reduce an investor's volatility.
In the article "Material World," Financial Planning found that a low correlation is a "valuable feature" for natural resources mutual funds. When author Craig Israelsen compared the correlation to the overall market to the 10-year annualized returns of 18 natural resources funds with 10 years of performance records, "a clear pattern" emerged. "Natural resources funds with lower correlations (that is, closer to zero) had better performances during this span," he says.
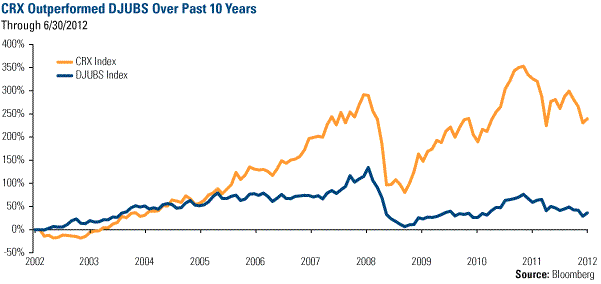
Over the past 10 years, this pattern was prevalent in the CRX, as commodity producers far outperformed the index of commodity futures.

How to Optimize Your Portfolio with Commodities
So how do correlations and long-term performance translate to your portfolio? One way to look at this would be to create an efficient frontier, which charts a range of allocations to commodities and the overall market to see which portfolio would be most efficient, i.e., which portfolio enhances returns without adding risk.
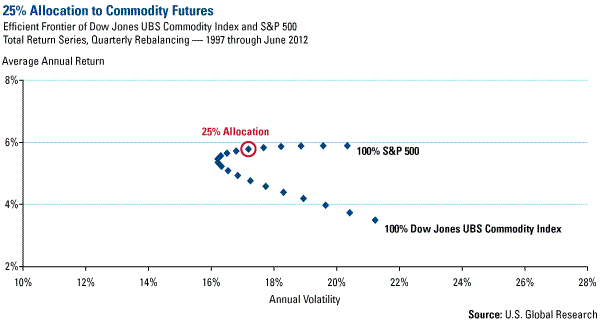
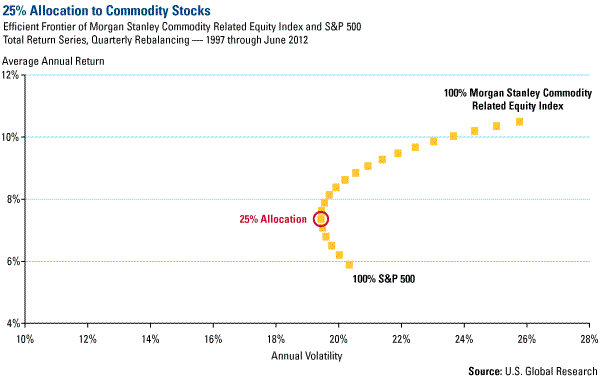
To find the optimal portfolio between commodities and the overall market, the efficient frontier plots different portfolios, ranging from a 100 percent allocation to an investment in the S&P 500 and gradually increasing the percentage of commodities. Each dot along the path of the efficient frontier represents an incremental increase toward a 100 percent allocation to commodities investment.
First, we chart the efficient frontier of the DJUBS and the S&P 500. A 100 percent allocation to the S&P 500 would result in a portfolio achieving a 5.9 percent return and 20.3 percent annualized volatility.
Assuming the portfolio was rebalanced each quarter, our research found that a portfolio holding 25 percent allocation to the commodities futures and 75 percent allocation to an investment in U.S. equities would decrease an investor's return by about 0.17 percent while decreasing volatility by a little more than 3 percent. Simply, the addition of commodity futures yields less volatility for about the same return.

A different picture emerges when you chart an efficient frontier for a portfolio invested in commodity equities and the overall market. In a portfolio of 25 percent commodity equities and 75 percent U.S. stocks, an investor reduces their risk by almost 1 percent while increasing their return by nearly 1.5 percent.

How Resourceful Is Your Portfolio?
The charts above illustrate how the power of commodities enhances a portfolio, although a 25 percent allocation may be a little too aggressive. For reference, about 15 percent of the S&P 500 Index is made up of energy and materials companies.
The Global Resources Fund (PSPFX) uses the CRX as its benchmark, and we're pleased to say that over the past 10 years, the four-star fund* has outperformed its benchmark, resulting in even greater returns for shareholders.
Put commodities to work in your portfolio today.
For more updates on global investing from Frank and the rest of the U.S. Global Investors team, follow us on Twitter at www.twitter.com/USFunds or like us on Facebook at www.facebook.com/USFunds. You can also watch exclusive videos on what our research overseas has turned up on our YouTube channel at www.youtube.com/USFunds.
By Frank Holmes
CEO and Chief Investment Officer
U.S. Global Investors
U.S. Global Investors, Inc. is an investment management firm specializing in gold, natural resources, emerging markets and global infrastructure opportunities around the world. The company, headquartered in San Antonio, Texas, manages 13 no-load mutual funds in the U.S. Global Investors fund family, as well as funds for international clients.
All opinions expressed and data provided are subject to change without notice. Some of these opinions may not be appropriate to every investor.
Standard deviation is a measure of the dispersion of a set of data from its mean. The more spread apart the data, the higher the deviation. Standard deviation is also known as historical volatility. All opinions expressed and data provided are subject to change without notice. Some of these opinions may not be appropriate to every investor. The S&P 500 Stock Index is a widely recognized capitalization-weighted index of 500 common stock prices in U.S. companies. The NYSE Arca Gold BUGS (Basket of Unhedged Gold Stocks) Index (HUI) is a modified equal dollar weighted index of companies involved in gold mining. The HUI Index was designed to provide significant exposure to near term movements in gold prices by including companies that do not hedge their gold production beyond 1.5 years. The MSCI Emerging Markets Index is a free float-adjusted market capitalization index that is designed to measure equity market performance in the global emerging markets. The U.S. Trade Weighted Dollar Index provides a general indication of the international value of the U.S. dollar.
Frank Holmes Archive |
© 2005-2022 http://www.MarketOracle.co.uk - The Market Oracle is a FREE Daily Financial Markets Analysis & Forecasting online publication.


