A Primary Stocks Bear Market
Stock-Markets / Stocks Bear Market Feb 12, 2008 - 04:42 AM GMTBy: Brian_Bloom
 Despite many conflicting signals from many different quarters, this analyst believes we have entered a Primary Bear Market for Industrial Equities.
A major source of confusion has been that the internet facilitates instantaneous dissemination of information. For that reason, the daily charts, whilst interesting, cannot be relied upon. They can be expected to give conflicting signals as the emotions ebb and flow with daily news.
A secondary issue is that, via derivatives, vested interests are able to (temporarily) wallpaper over the widening cracks – by artificially creating what appears to be a demand for selected shares and/or indices.
But the great tide of the market cannot be manipulated, and cognisance needs to be taken of the hard fact that the environment today differs from that which prevailed when people like NM Rothschild strutted the stage. In those days short term “arbitrage” was possible. When one person had information that another person did not have, he was able to capit ali se on that fact.
Nowadays, the only people who have access to information that is unique are the people who originate that information. Once they choose to make a particular piece of information available, within hours, everyone has it. Arbitrage – the balancing out of pluses and minuses in perceptions of value – is a thing of the past. For that reason – and because the primary direction of the market has been in question – “short term trading” techniques that may have worked in the past just cannot be relied on for equity trading.
Armed with this understanding, we are forced to face up to the fact that we really need is a deep understanding of values, and we also need to monitor the great tide of the market. Everything else is “smoke”.
One method of monitoring that great tide – which has worked for decades – is Dow Theory. I hesitate to just summarily dismiss that theory, but I am focussing on two facts. In context of the fact that around 60% of all transport within the USA is oil dependent, and in context of the fact that the world has passed “Peak Oil”, the demand/supply equation has become fractured. Those people who operate within the oil and transport industries have a strategically unique (and temporary) opportunity to make a once-in-a-lifetime killing. They can pass on price rises, and the public has no choice but to accept these price rises. That's why (in this analyst's view) the Dow Jones Transport Index is refusing to confirm the Dow Jones Industrial Index – which, in my view, is manipulable in any event using derivatives, because it only consists of 30 stocks which are biased in favour of bull markets. “Bad” companies are cut out and “good” companies replace them.
I am therefore unable to accept that Dow Theory today – whilst probably still a valuable tool – is as powerful as it was in the past.
The following article caught my eye a few days ago: http://www.dailymail.co.uk/pages/live/articles/news/news.html?in_article_id=511387&in_page_id=1770
Shell's 'obscene' £13.9billion profit is biggest ever by British company
Here is a quote from this article: “Upstream production, which accounts for more than half of profits, averaged out at 3.315 million barrels of oil or their gas equivalent a day, just squeezing in to the forecast of between 3.3 million and 3.5 million.
That itself had been a major downgrade from the 3.8 million Shell had previously predicted. The company today said it expected production levels to fall again in 2008.
The biggest issue for Shell is the shutout from wells it has been co-producing in Nigeria - potentially 800,000 barrels a day - where local militia continue to demand that the world's major companies quit the Niger Delta.”
As with Exxon in the USA , volume of throughput of oil has been falling in the recent past.
From a 100,000 foot perspective, in this analyst's view, what we have been witnessing in the DJ Transport Index is a sort of “Indian Summer” – where the underlying companies have been basking in the warmth of an ability to pass on rising costs at a fixed percentage mark-up. But those days are drawing to a close. Eventually, the issue will not be “margin” it will be “availability”.
Not to put too fine a point on it, the evidence suggest that we are heading for oil shortages and supply interruptions – against a background where 60% of transport within the USA is dependent on transport.
Let's look at the technical evidence:
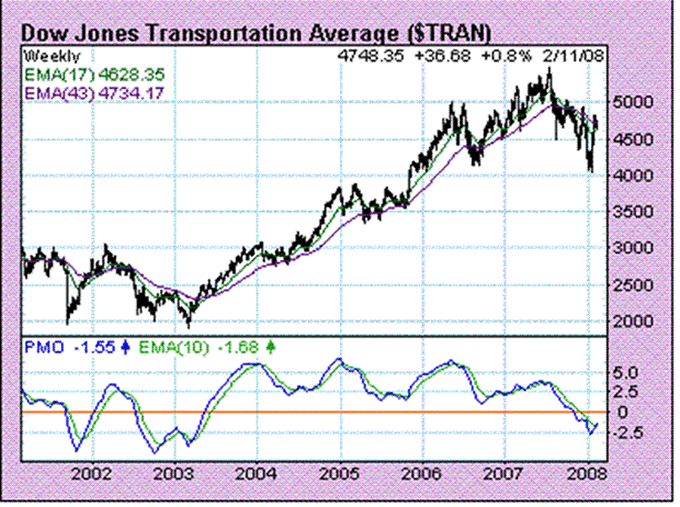
Let's examine the above chart of the Transportation Index (courtesy DecisionPoint.com) in context of the oil price chart below from 2003 onwards.
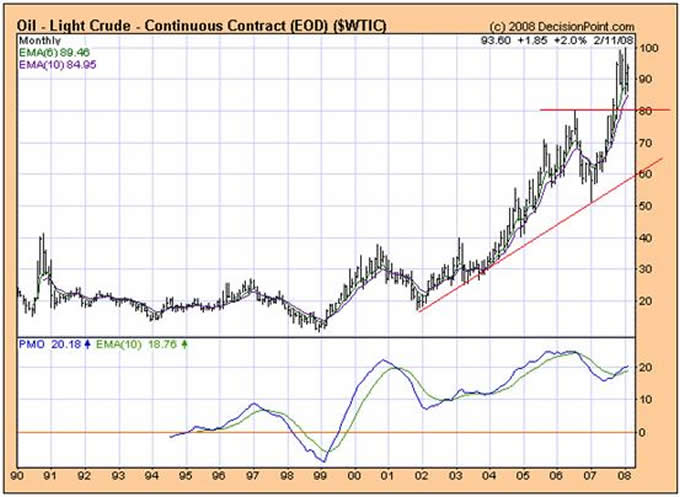
In early 2003 the oil price rose to a short term peak of $40 a barrel and, at that point, the Transport Index bottomed. That was the point at which the transport industry made a breakthrough. They discovered they could pass on rising costs without it impacting on volume demand.
Then, in 2004, when the oil price started to rise strongly, the Transport Index also started to rise strongly. If you take the trouble to examine Exxon's accounts, you will see that the company marks up by a fixed percentage of around 70% to 75%. When the oil price rises, the oil company's profits rise strongly in dollar terms– because demand is inelastic. The same logic applies to transportation. As a matter of passing interest, there appears to be a law in the USA (I'm not sure if it applies in all states) where a service station must add a minimum percentage mark-up to the cost of its gasoline.
Of interest, the oil price exploded in 2007 and the Transportation Index fell in the latter half of 2007. The Indian Summer may be giving way to winter.
So, if we understand that the Transport Index is now no longer a reliable forecaster of underlying economic activity as measured in volume, and we understand that the Dow Jones Industrial Index – which consists of a mere 30 stocks – is capable of being manipulated, what's left?
Well, we need to look at the Dow Jones Monthly Chart relative to the Standard and Poor Monthly chart to get a meaningful view of the great tide of the market.
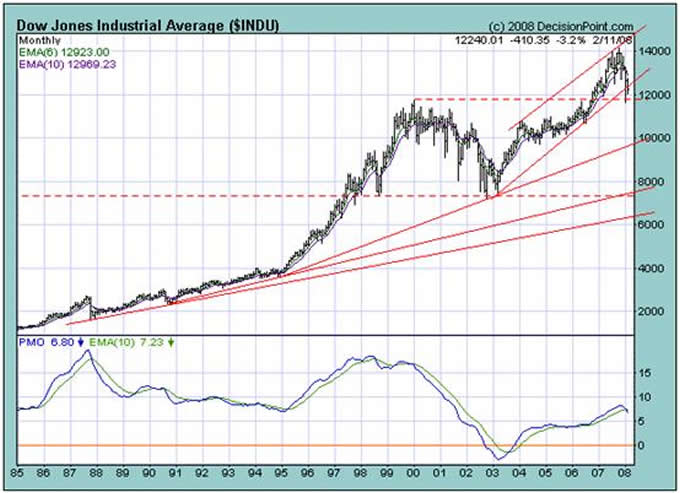
Note how the DJIA index rose way above its 2000 peak, and is only now peeking through the downside of its rising trendline. Although, significantly, the PMO oscillator appears to be giving a tentative sell signal as the blue line crosses over below the green moving average line.
Contrast this with the $SPX chart below
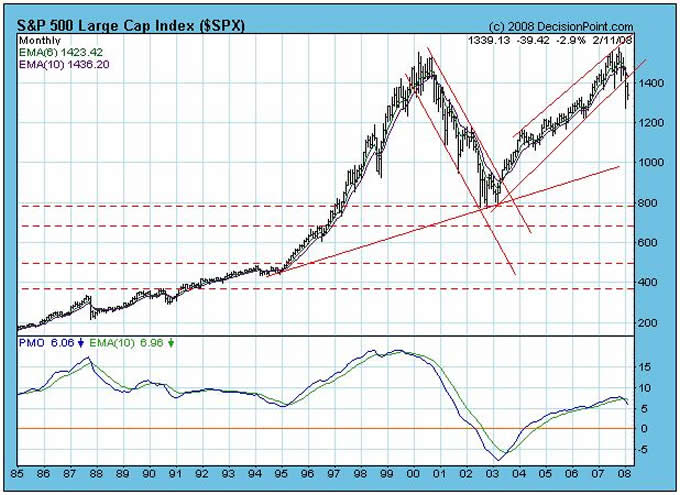
- The index failed to rise above its 2000 high – thereby hitting what is technically known as a “double top”; which is bearish
- The price is far below is rising trendline
- The sell signal on the PMO is far more pronounced
Interim conclusion
The $SPX – which reflects investor perceptions of the performance of 500 large underlying businesses – is giving clear sell signals following its failure to rise to a new high. By implication, we have entered a Primary Bear Mark et.
Now what does this mean for commodities in general and gold in particular?
If you look at the chart below – of the Reuters Commodities Index – you see what may be the beginning of an exponential blow-off in prices
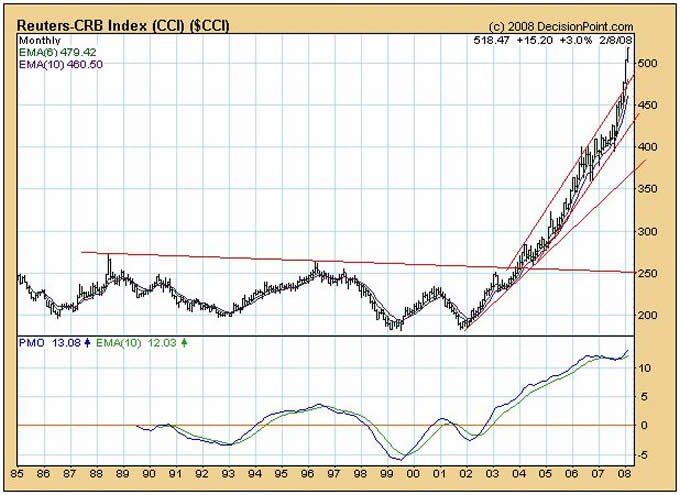
There are two question of importance which arise from this:
- How high is “up”? (How high can it go?)
- Why is it rising like that?
The first question is impossible to answer. We are entering uncharted territory. The issue on which this analyst is focussing is that an “exponential blow-off” typically ends in a catastrophic collapse. Apparently, all biological systems work this way. They explode to the point where they are unsustainable, and then they collapse.
Why it's rising like that is probably partially a function of the fact that most commodities (gold included) are priced in valueless US Dollars which, at November 2007, were backed roughly 2.4% by gold. It's also probably partially a function of the fact that the world is heading for shortages across the board – not just in oil.
World population is trending towards 7 billion, and those who have assets are scrambling out of “suspect value” assets and into “hard value” assets.
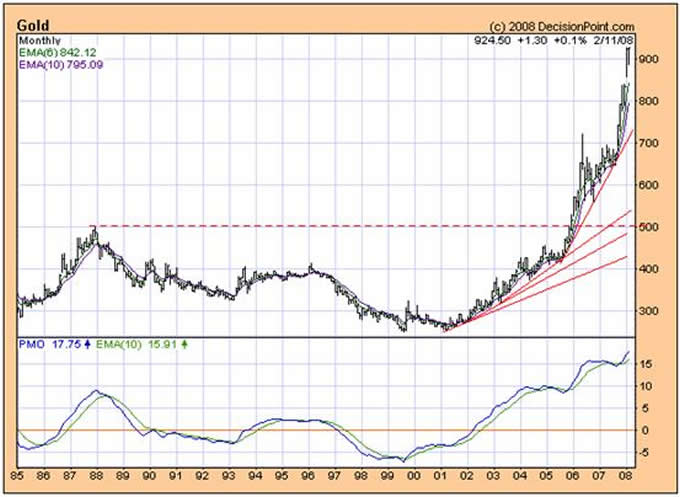
The chart of gold is showing a similar picture, but one needs to bear in mind that gold, too, is a subject of price “management”. The financial authorities do not want to see the price of gold rise, so it has been far more volatile than other commodities; even as all commodities been rising.
Of course, wild heart stopping swings in the gold price may still be expected. But things may be changing. Frankly, I wouldn't be surprised to see the monthly gold price manifest additional upside gaps in the months to come.
But lets' stop and look at a chart of the relationship of gold to commodities for a few seconds (chart courtesy stockcharts.com)
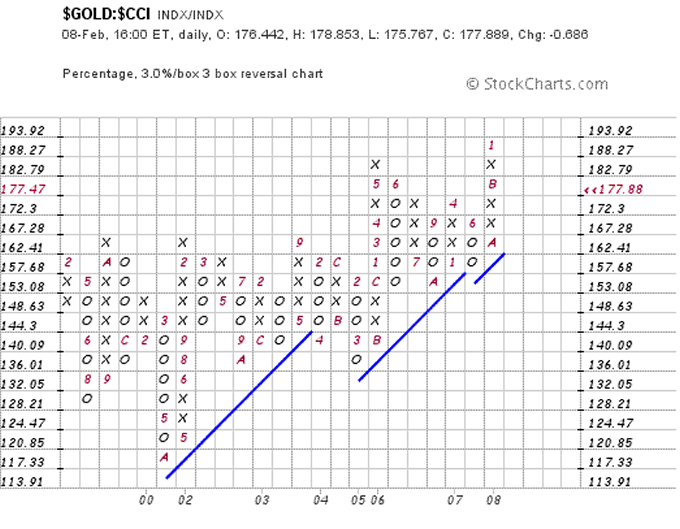
Note how this (desensitised) 3% X 3 box reversal chart broke to a new high and then pulled back. Whilst this is most unusual, right now, the buy signal is still in place. Gold is signalling the possibility that it may soon begin to outperform commodities in general.
What does all this mean?
There are so many variables out there, and the world in which we live has become so complex, and so information rich, that for most people it's very difficult to see the wood for the trees. There's just too much information for the average person to cope.
This analyst has an inclination to want to ignore 99% of all information and treat it as “noise”. To this analyst, what all the above means can be summarised in one sentence: ‘We are witnessing the emergence of the consequences of Peak Oil, against a background where vested interests consciously blocked the march-to-market of replacement energy technologies,'
It means that, in the USA , where 60% of all transport is dependent on oil, and where oil volume throughput is slowing down, volumes of transactions are likely to slow – and “velocity of money” is likely to slow.
t means that, against a background where the authorities continue to believe that “money” will stimulate the economy (which is the equivalent of pumping oxygen into a patient suffering from malnutrition) the USA inflation numbers published by the authorities are probably garage. The authorities are filling the patient's lungs when they should be filling his stomach.
Conclusion
The US Industrial Equity markets have more than likely entered a Primary Bear Mark et. Shortages will possibly begin to manifest in the coming months and years. The US authorities' response – which has been to man the financial printing presses – is unlikely to have any constructive impact of any consequence, because it has not even been aimed at the real target.
Ultimately, in this analyst's view, history will show that the decision makers screwed up big time. They forgot that Mother Nature is the source of all wealth and they failed to understand that you cannot “financially engineer” wealth. Wealth creation occurs by the application of human ingenuity and endeavour – as augmented by an external energy source – and which gives rise to an improvement in the qu ali ty of life in general, and across all of society.
The authorities failed to respond to the problem of Peak Oil, because they were protecting vested interests. Because of this failure, we have been manacled and chained to the wrong energy paradigm – a paradigm which is yielding obscene, but temporary, profits to those who are strategically well positioned.
By Brian Bloom
Australia
www.beyondneanderthal.com
So far, this analyst has identified four electromagnetic energy technologies which warrant further serious investigation. Whilst many physicists will argue, a priori, that none of these is practical, I believe they may be missing something very important. My editor is currently struggling to complete the editing process of Beyond Neanderthal (in which two of these technologies are presented in some detail) and the publisher is now hoping to publish the novel in April 2008. Please register your interest to acquire a copy at www.beyondneanderthal.com .
Copyright © 2008 Brian Bloom - All Rights Reserved
Brian Bloom Archive |
© 2005-2022 http://www.MarketOracle.co.uk - The Market Oracle is a FREE Daily Financial Markets Analysis & Forecasting online publication.


