Gold Long Term Bull Market
Commodities / Gold and Silver 2012 Sep 26, 2012 - 12:17 PM GMTBy: Tony_Caldaro
 Patrick McGough
writes:
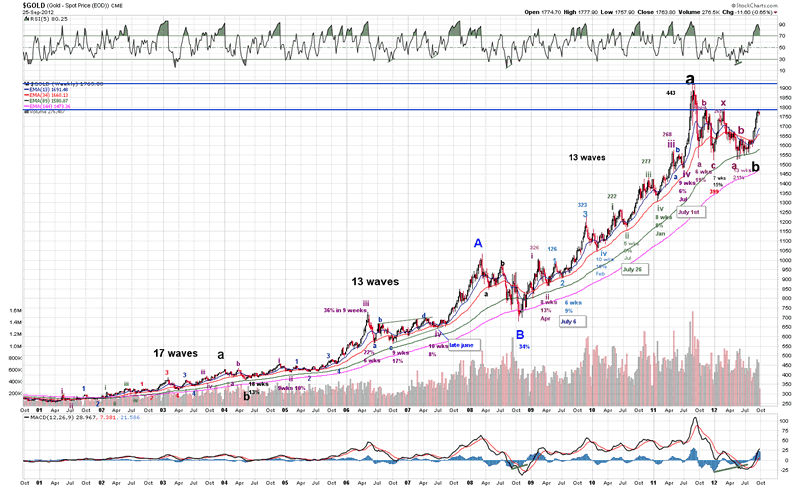
The Gold Bull market started during the first quarter of 2001, and has now been in play for approximately 11 1/2 years. Commodity cycles tend to have 13 year bull markets and 21 year bear markets. This completes a 34 year cycle and for the moment Gold appears to be in the last 1-1 1/2 years of this cycle. Fortunately for us traders this tends to be the most explosive part of the cycle. In the actual economy Gold really does not serve as a commodity but as a currency. If this were not the case why do central banks accumulate or hold gold as reserves? The yellow metal is truly the currency of last resort.

We have been counting Gold as a large impulse, but if one looks at the 1967-1980 bull market the count was certainly corrective. Furthermore no currency or commodity market moves with a long term impulse. The two other major Precious metals Platinum and Silver do not have long term impulses, so with that in mind the gold count was changed to reflect a long term corrective count. This does not change the long term targets, but only seeks to try and represent Gold’s true Elliott Wave (EW) nature.
Before moving down to the daily charts let’s take a look at two basic details in the weekly chart. When looking at waves for EW it is critical to remember the impulse numbers (5, 9, 13, 17, 21, 25, etc). First notice that Major a/Primary A completed with 17 waves up, and Major c/Primary A completed with 13 waves up. It would seem that Major c/Primary A “cycled” down one wave set. If this were to occur for Primary C we should expect 9 waves up for the final Major c.
The second detail is just some basic Fib projections.
Major a / Primary A (2001-2004) = 69%
Major c / Primary A (2004-2008) = 178%
Major a / Primary C (2008-2011) = 183%
Each of the major waves have approximately a 2.618 extension to the first major wave in the bull market. This leads to a rather simple bull market top projection (69% = $2580 & 180% = $4,270). As mentioned above these targets should be hit in the next 1 – 1 1/2 years. After this it may not be very wise to be long gold.
Medium Term
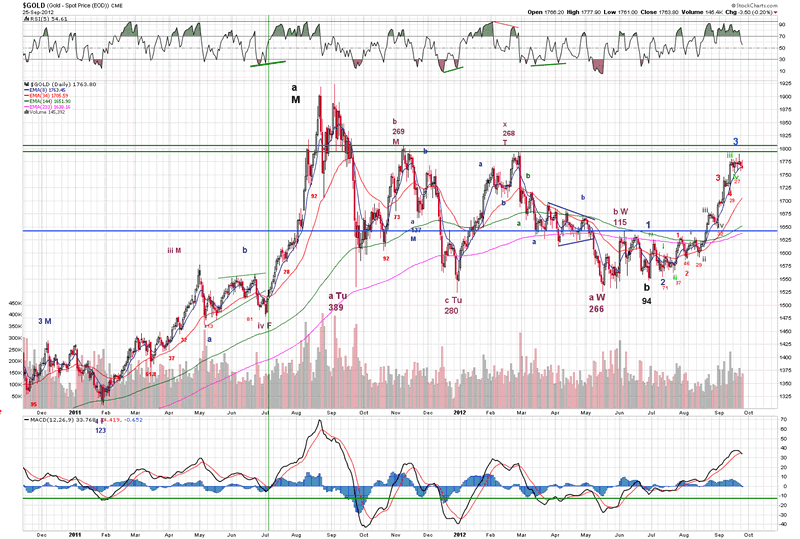
The current uptrend began in late June and ended an ~ 8 1/2 month correction from $1923 – $1526 (21%). From the truncated low of $1547 Gold has risen 16% to $1790. Notice there are two resistance pivots at $1793 and $1804. This area should prove to be an issue for Gold over the next few weeks.

Currently Gold has a significant negative divergence and looks like we could get a bearish MACD cross. We should expect Minor 4 to correct anywhere between $35 – $65, and the uptrend should then resume. Gold could potentially make a new high during this uptrend, but the $1800 – $1830 level should provide stiff resistance. First target for Intermediate i = $1820 – $1830 and second target new bull market highs ($1920-$1950).
Short Term
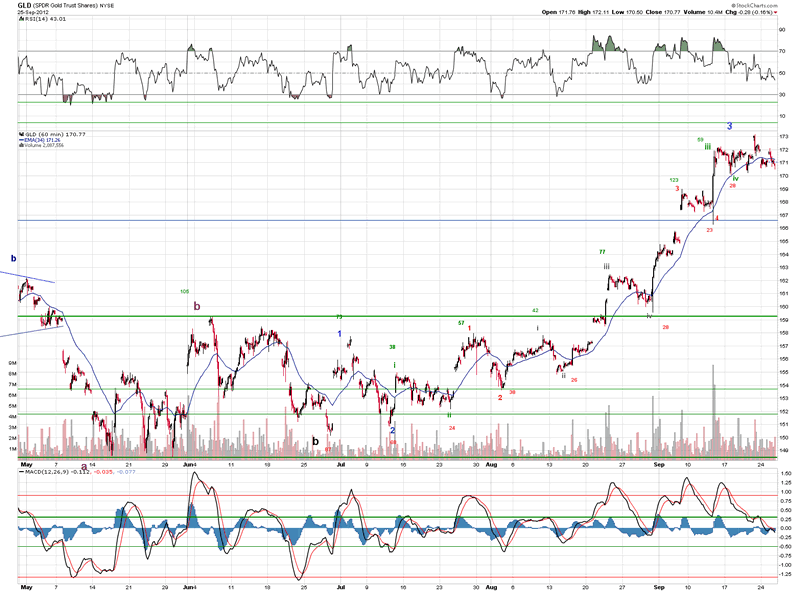
The shorter term charts tend to offer many more probabilities, so let’s try to view this time frame in the proper prospective. This impulse wave can be counted in a few different ways, but we try to stick to the most obvious count. The GLD recently ran into resistance at the March 2012 and November 2011 highs, and for the moment it appears Minor 4 started on Friday last week. Minor 4 should find support around the $1690-$1660 level in GLD.

Alternate Count
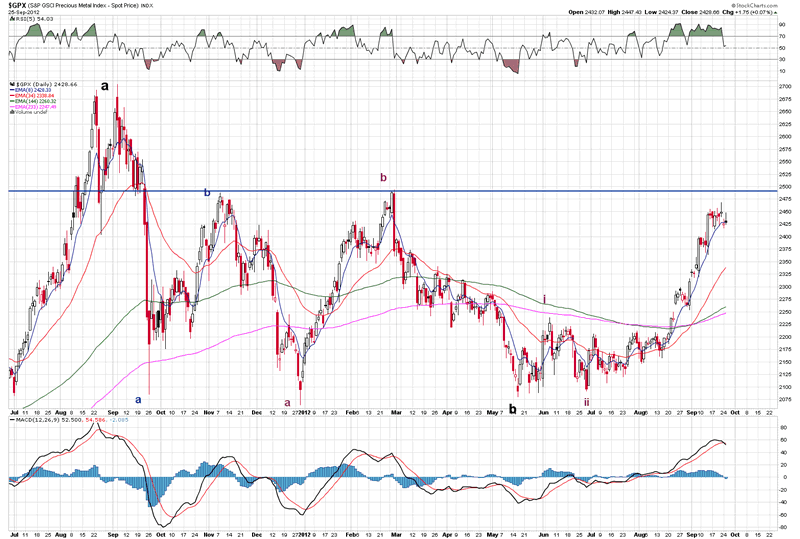
The truncated wave in late June causes technicians a minor problem. Was it really a truncated wave or a true uptrend? For the moment the best answer is that we can’t be 100% sure either way. For this reason an alternate count will be included on the GPX chart.

This count would mean Gold is most likely in Minor 1 up of a potentially extending Intermediate iii wave. The next correction will give us some clues as to whether or not this alternate count is viable. Enjoy the rest of this Gold bull market, since late next year will most likely end up marking the end of what has been a very nice bull run for the yellow metal.
CHARTS: http://stockcharts.com/...
http://caldaroew.spaces.live.com
After about 40 years of investing in the markets one learns that the markets are constantly changing, not only in price, but in what drives the markets. In the 1960s, the Nifty Fifty were the leaders of the stock market. In the 1970s, stock selection using Technical Analysis was important, as the market stayed with a trading range for the entire decade. In the 1980s, the market finally broke out of it doldrums, as the DOW broke through 1100 in 1982, and launched the greatest bull market on record.
Sharing is an important aspect of a life. Over 100 people have joined our group, from all walks of life, covering twenty three countries across the globe. It's been the most fun I have ever had in the market. Sharing uncommon knowledge, with investors. In hope of aiding them in finding their financial independence.
Copyright © 2012 Tony Caldaro - All Rights Reserved Disclaimer: The above is a matter of opinion provided for general information purposes only and is not intended as investment advice. Information and analysis above are derived from sources and utilising methods believed to be reliable, but we cannot accept responsibility for any losses you may incur as a result of this analysis. Individuals should consult with their personal financial advisors.
© 2005-2022 http://www.MarketOracle.co.uk - The Market Oracle is a FREE Daily Financial Markets Analysis & Forecasting online publication.


