Bernanke QE to infinity Sacrificing the U.S. Dollar
Stock-Markets / Financial Markets 2012 Sep 23, 2012 - 12:41 PM GMT For those that remember there is a great film called The Ten Commandments and a classic line by Yul Brynner “So it is written so it shall be done”
On the 13th September Ben Bernanke did something that will likely go down in history, I won’t bore readers any further with the details suffice to say “So it is written so it shall be done”.
It’s been a while that I have penned an article so there is a lot to want cover in this article.
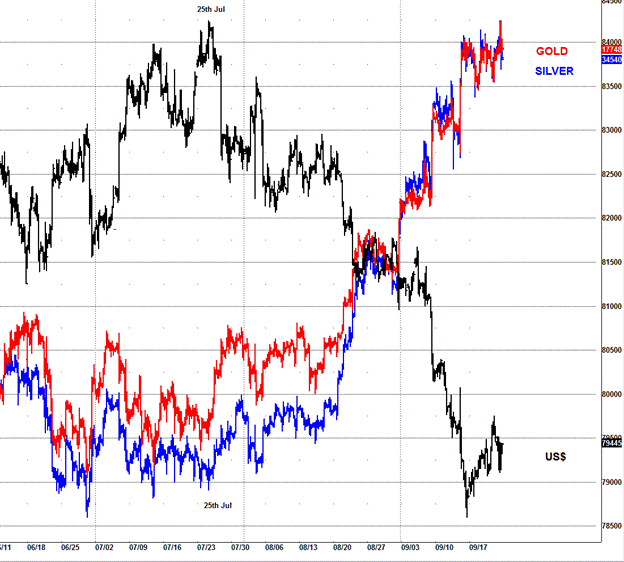
With Ben Bernanke offering QE infinity to the markets, it appears that the FED is willing to sacrifice the US$, although the US$ had already been pushing lower from the 25th Jul pivot highs, so it got the welcome gift from the FED it needed to kill it off for good.
As the DX was approaching into the July 25th highs, I was working 2 ideas, but had a long term target at 84.20 on the DX (aka US$). It literally hit my long standing target and reversed, we were looking for a significant rally in the EURUSD at the time, when most were bearish on the EURUSD, I was at my most bullish at 12050 on the EURUSD as it fell into it a target band.
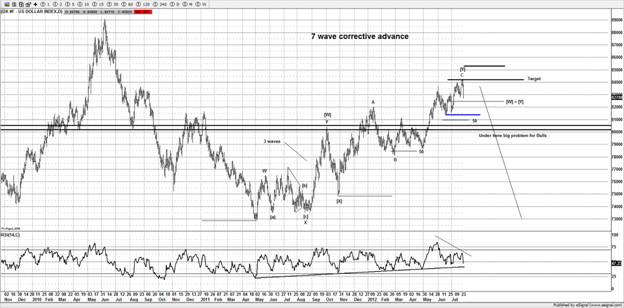
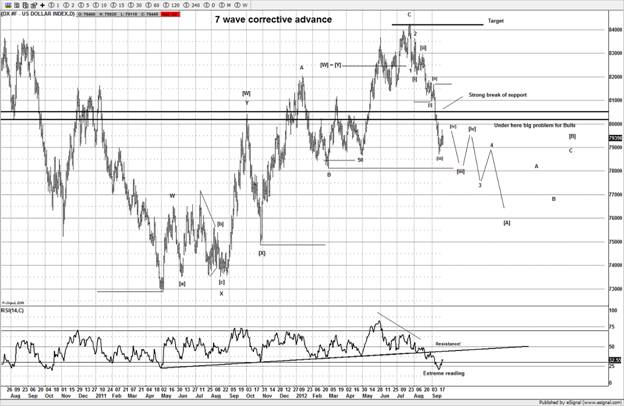
Fast forward the rally that started from 2011 ended at the 25th July 2012 highs. With a little help from Ben Bernanke the US$ appears to be in serious trouble and I have 2 targets lower down towards 75 or 73.
I wrote this at the time for members.
“It always starts off with no one believing, and trust me no one believes it here but that is a very valid wave count”
Many traders were very bullish the US$ and bearish EURUSD and the precious metals, you could not find many US$ bears into the 25th Jul highs, yet I was very bearish as it approached my 84.20 target.
What is so relevant about the US$ and the 25th Jul reversal date?
Well virtually most markets that are traded are moving off the back of the US$ movements, EURUSD, Gold and Silver bring to mind.
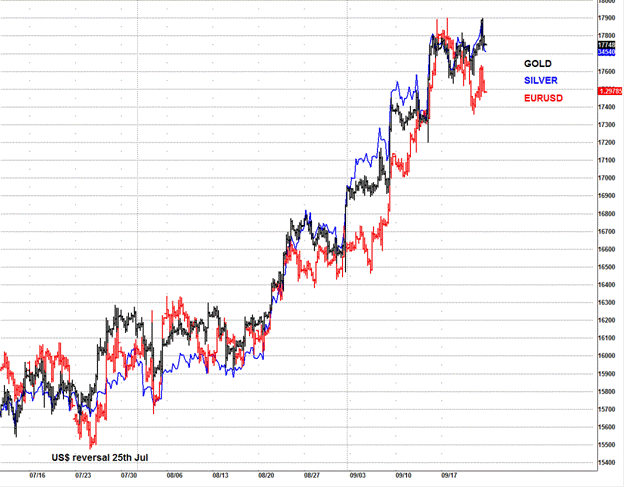
Do you notice anything? All 3 markets started a strong rally higher from the 25th Jul pivot date, so as the trend has broken now to the downside on the US$ (DX) traders need to embrace that, only a strong reversal back above 80.50 on the DX would the bears need to be concerned, but it appears that the loss of support on the DX has setup EURUSD, Silver and Gold to push higher.
So if readers don’t have access to the DX chart you can use the EURUSD for guidance as it’s a good proxy, although we are tracking Elliott Wave patterns and as long as we hold key support we remain long EURUSD and the precious metals, Members are aware of our key areas, if they hold, then the trend is a simple trade and one that I think remains into the US elections at least, maybe 2013.
EURUSD
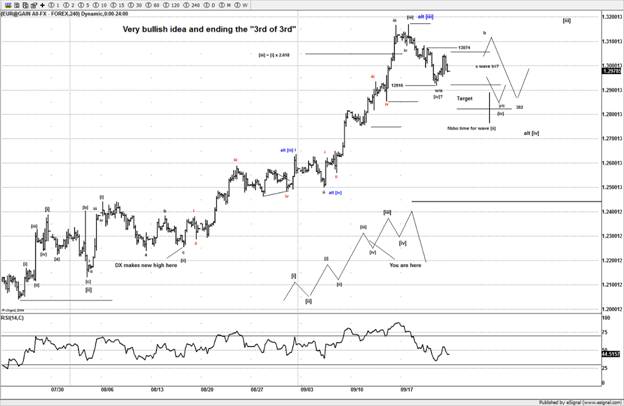
As mentioned, back into the July 25th pivot I was looking for a major low in the EURUSD, for a move to at least 12750. As usual most traders were bearish at the lows, just at the time when the trend was setting up to reverse.
If you look carefully you can clearly see a 5 wave decline, just that fact alone was telling Elliotticians that a reversal was setting up, with the DX suggesting a reversal, it was clearly setting up an important reversal. One that I was certain would surprise many traders.
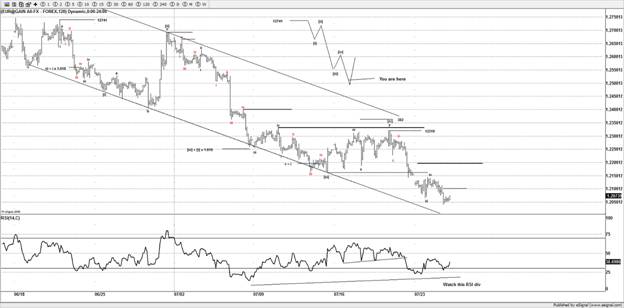
Headlines like the EURO is doomed simply got me even more bullish, with the DX hitting the 84.20 target I knew it was the right time to be looking for a strong reversal in both the DX and EURUSD, when the news is at the worst and I see a 5 wave decline, that’s when I get bullish and look to fade the crowd.
Fast forward and the EURUSD has exceeded my target and some, and looks like it’s got far higher prices ahead of it, as the US$ has braking support translates into Gold, Silver and EURUSD higher as shown on the chart above.
Potentially targets towards are 135 in this leg from the 25th Jul pivot date.
Gold
I have been looking for a low from far back as May this year, as I switched to the bullish wave count, as the decline from last year failed to decline and show bearish price action, the bears had the chance to push the markets lower but over the summer the lack of breakdown under the $1500 suggested that a base was being built and wave 5 wave about to launch higher.
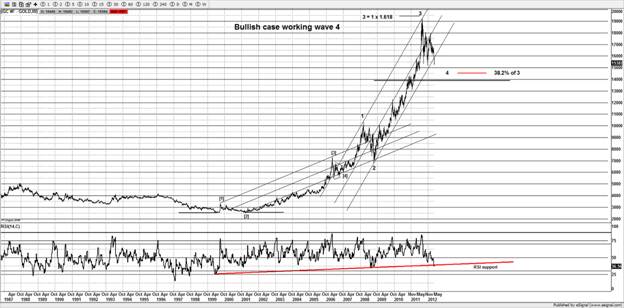
I believe the wave 5 started at the July 25th pivot date as you can see that moves on Gold and Silver simply went ballistic as I expected they would on the back of the US$ collapsing. As long as the US$ stays in collapse mode and heads lower I expect Gold to reach new all time highs.
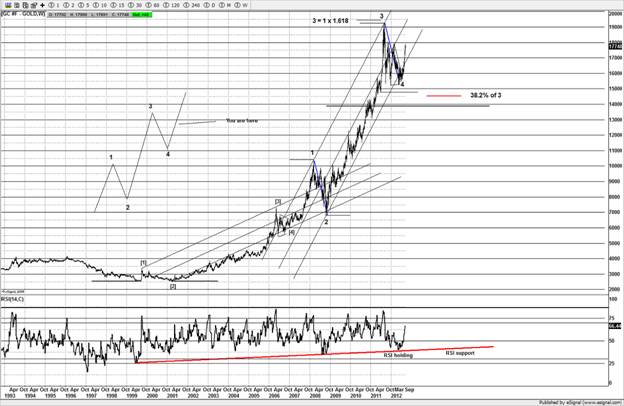
However short term we are coming into substantial resistance and my work suggests that a pullback towards $1720 could be seen over the coming days.
If you look left you will notice the resistance at the $1800 area, as well as targets from previous fractals coming into focus.
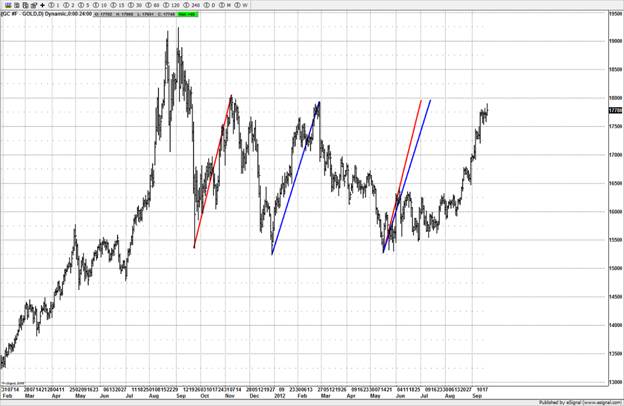
As we are well into this trend, its only now we are seeing traders wake up to the trends in Gold and Silver, but if the current ideas work out as expected, the sentiment will be more than it currently is, as Gold pushes to new all time highs, although we have some caution areas below, should Gold see a substantial sell off, but as long as support holds we remain bullish and looking for new all time highs.
Targets are based on wave structure, but traders should expect extreme bullish sentiment readings, the exact opposite to this summer just gone, the bearish articles and that fact no one wanted to own the metals.
I expect sentiment to start to pick up on Gold now, as this pushes higher over the coming weeks.
If you recall last year we saw extreme sentiment readings as Gold as it made new all time highs just before it saw a substantial correction. Only on a new high, it suggests an end to the bull market that started from the year 1999.
For now as long as Gold holds our key support areas on a correction, we remain bullish and look to continue to remain bullish.
Remember no one wants to buy it at the lows when it’s nice and cheap at $1530 but I suspect many will want to buy Gold at new all time highs.
Oil
Oil has spent the past 18 months or so inside a large range, and the suspected pattern is a triangle, and potentially a great setup shortly for a move higher as the market chops around our key target band between $88-91, we are looking for a substantial low for wave [E]
As QE infinity should see some of that free $$ hit risk markets such as Oil, although it appears the US administration appears to be doing its hardest to contain the Oil rally, but market has a way of punishing the bad policies of unlimited spending.
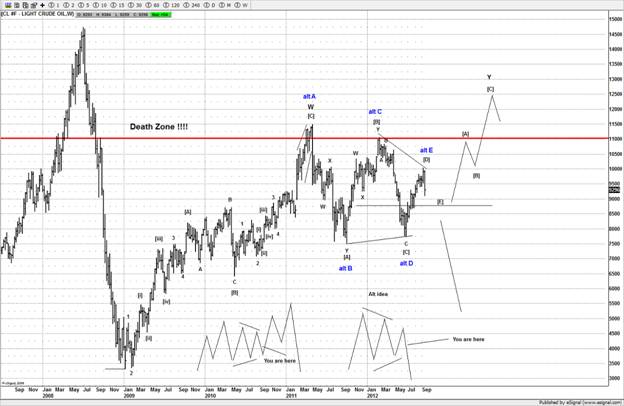
I have wrote about oil before passing a key area, and the damage it causes to the economy as costs increase due to Oil prices moving higher, things such as transports costs as well as normal every day folks forced into paying more money at the gas station has a knock on effect to the economy.
Not only does it hurt earnings from companies, if the average guy on the street has to spend more on living costs, then have less to spend on luxuries.
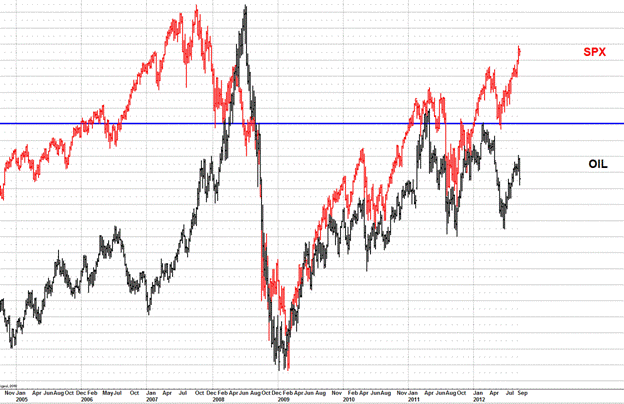
History shows us that above $110 is a big problem for the economy and US stocks, the only 2 times its surpassed that area it foretold of a substantial breakdown in US stocks, although I am expecting an attempt to test that area again. SO the message is clear, the higher Oil is above $110 the larger the collapse in US stocks. The chart speaks for itself, those are the facts.
So if we see $130-150 Oil, get ready for the collapse in the US stocks markets.
It’s at that point I am fairly sure that like back in 2008 the economy and US stock markets will collapse, but for now, as traders we must embrace the QE infinity trade until such a time Oil tests $110.
Conclusion
With the QE infinity trade causing the US$ to push lower, the trade is to get long EURUSD, Gold and Silver (subject to dips etc), the FED appears hell bent on destroying the US$, at what cost to the economy no one knows, but I am sure in the future it will have substantial repercussions, but as traders, we must ignore that and embrace the market trends.
The markets love the free $$$.
Only an aggressive reversal in the US$ do traders need to be cautious, as long as the DX remains under 80.50 sell corrective bounces in the US$.
Have a profitable week ahead.
Click here to become a member
You can also follow us on twitter
What do we offer?
Short and long term analysis on US and European markets, various major FX pairs, commodities from Gold and silver to markets like natural gas.
Daily analysis on where I think the market is going with key support and resistance areas, we move and adjust as the market adjusts.
A chat room where members can discuss ideas with me or other members.
Members get to know who is moving the markets in the S&P pits*
*I have permission to post comments from the audio I hear from the S&P pits.
If you looking for quality analysis from someone that actually looks at multiple charts and works hard at providing members information to stay on the right side of the trends and making $$$, why not give the site a trial.
If any of the readers want to see this article in a PDF format.
Please send an e-mail to Enquires@wavepatterntraders.com
Please put in the header PDF, or make it known that you want to be added to the mailing list for any future articles.
Or if you have any questions about becoming a member, please use the email address above.
If you like what you see, or want to see more of my work, then please sign up for the 4 week trial.
This article is just a small portion of the markets I follow.
I cover many markets, from FX to US equities, right the way through to commodities.
If I have the data I am more than willing to offer requests to members.
Currently new members can sign up for a 4 week free trial to test drive the site, and see if my work can help in your trading and if it meets your requirements.
If you don't like what you see, then drop me an email within the 1st 4 weeks from when you join, and ask for a no questions refund.
You simply have nothing to lose.
By Jason Soni AKA Nouf
© 2012 Copyright Jason Soni AKA Nouf - All Rights Reserved
Disclaimer: The above is a matter of opinion provided for general information purposes only and is not intended as investment advice. Information and analysis above are derived from sources and utilising methods believed to be reliable, but we cannot accept responsibility for any losses you may incur as a result of this analysis. Individuals should consult with their personal financial advisors.
© 2005-2022 http://www.MarketOracle.co.uk - The Market Oracle is a FREE Daily Financial Markets Analysis & Forecasting online publication.


