


Agricultural Commodity Markets Inflationary Peak Forecast 2013
Commodities / Agricultural Commodities Sep 20, 2012 - 03:42 AM GMTBy: John_Hampson

 Agricultural commodities prices resumed upward trends in June 2012, largely due to drought conditions in key global farming areas on top of existing low inventories. Extreme global conditions continue, with the period June-August of 2012 the hottest such period historically on record.
Source: NOAA
Taking a broad agricultural commodities ETC (ETF), we can see that softs are now back up into the price range experienced in 2011, and not far from 2008′s peaks.

Agricultural commodity price rises typically feed through to retail food prices 4-6 months later, which means we could expect food prices to really escalate as of the final quarter 2012. Here is the UN food price index up to the end of August 2012:
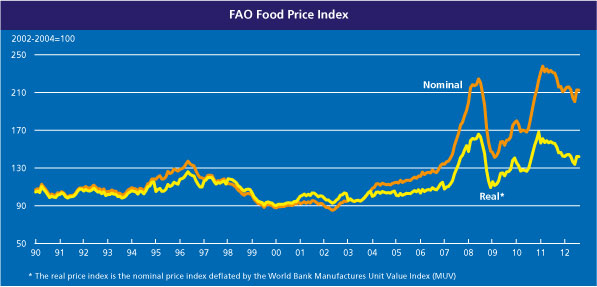
Source: Food And Agriculture Organisation Of The United Nations
Now take a look at how the 2008 and 2011 episodes of rising food prices brought about social unrest and political upheaval in poorer countries across the world:
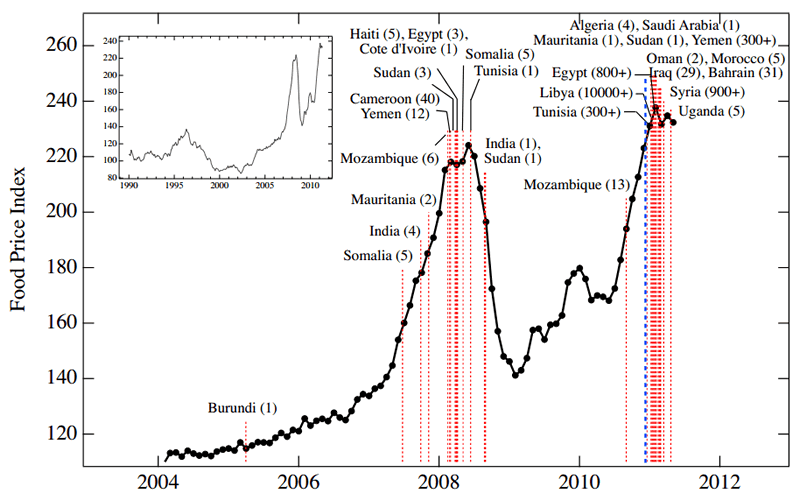
Source: NECSI
The chart shows when outbreaks of violence erupted in different countries. As food prices escalate towards those levels again as we reach into 2013, the likelihood is of renewed protest and conflict.
We can cross-reference this with solar cycle studies. 2013 is the year of the forecasted solar maximum. Alexander Chizhevsky’s analysis of 2500 years of human history and solar cycles revealed that the period into and around solar maximums (4 years) was historically one of protest, revolution and war. Last year’s North African and Middle Eastern revolts fit with this, as does the prospect of food-price based protest and conflict into 2013.
The Arab Spring revolutions and protests in 2011 brought about oil supply disruption, both real and perceived, which in turn rallied oil prices. Rising oil prices feed back into food prices through processing and distribution. Precious metals in turn benefit as inflation hedges. A price feedback loop develops between these different commodities, and a feedback loop also occurs between commodity price rises and social conflict.
These two charts confirm the close inter-relations of food prices with oil and gold:
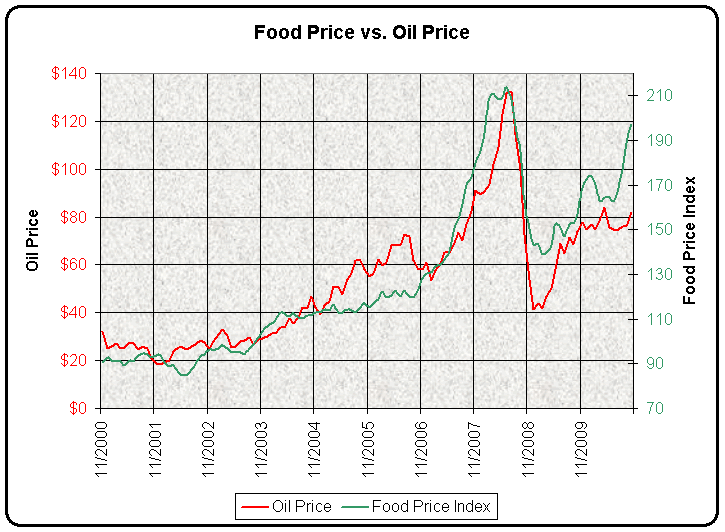
Source: Prudent Investor
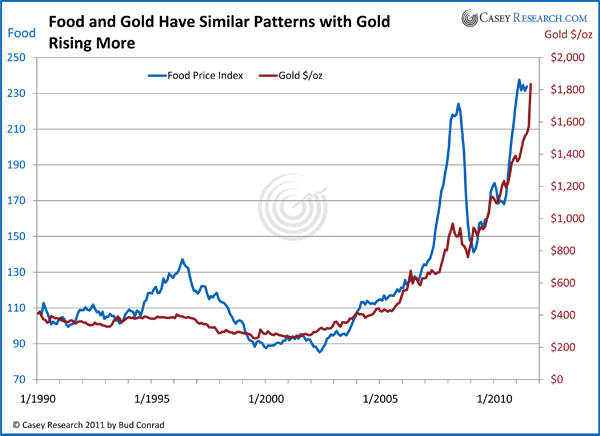
Source: Casey Research
As we stand in September 2012, energy and metals are lagging soft commodities as supportive evidence for an inflationary spike in 2013. Global economic weakness is the reason, whilst grains have accelerated largely on extreme weather conditions. In response to the economic slowdown, central banks have cut interest rates and renewed stimulus (such as China’s infrastucture programme and US Quantitative Easing (QE) 3). This in turn should be reflationary, which should lift commodities as a class. In reponse to the US Fed’s announcement of renewed QE, five year inflation breakeven expectations surged, as shown in the chart below. Official inflation, CPI, has historically followed this indicator with a lag, suggesting inflation should accelerate as we enter 2013.
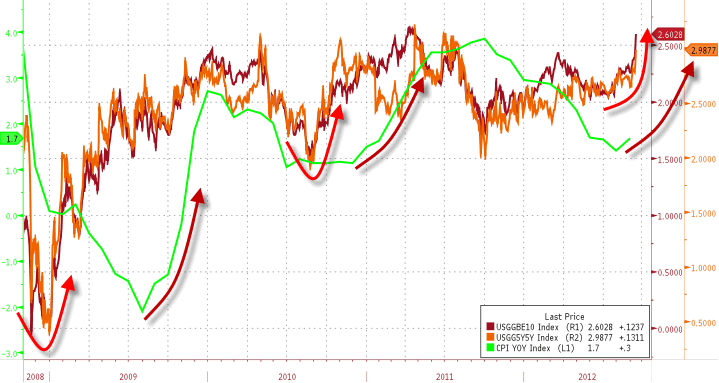
Source: Zerohedge
There is a feedback loop here too, as rising inflation inspires more money into hard assets as inflation hedges, which lifts commodity prices, which in turn brings about higher inflation.
With renewed QE, the US Fed continues its policy of massive money supply expansion, although this is not as potent as it might be, due to a weak money multiplier. However, the money multiplier shows evidence of having bottomed out and dollar circulation in the economy is beginning to gather pace, which can be inflationary.
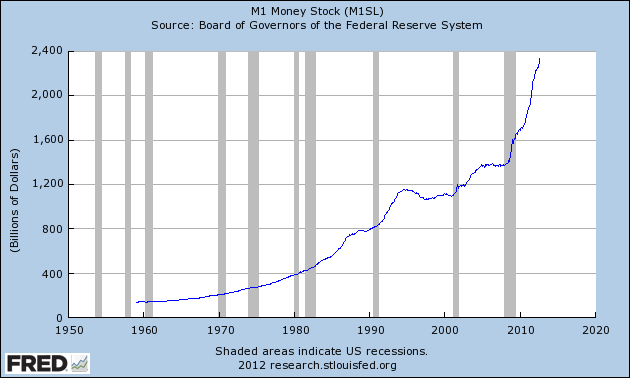
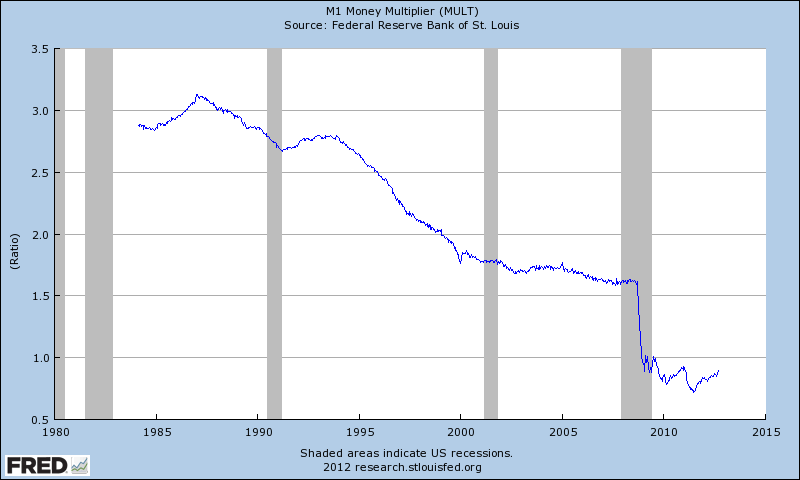
Source: St Louis Fed
Renewed QE also devalues the currency. As the US dollar is the world’s reserve currency, to which many nations peg their currencies, a US dollar devaluation acts as a global devaluation. As commodities are priced in US dollars, this global currency devaluation typically brings about a commodities revaluation (hard assets rising in value versus paper).
The first chart below shows that the US dollar is labouring at secular lows in real terms, whilst the second chart shows that it is gradually making a rounded base around these levels. Its recent technical behaviour post QE announcement, namely the loss of a key support, in addition to its languishing near secular lows, suggests that it can provide the backdrop for an inflationary finale into 2013, before a new secular dollar bull gradually emerges.
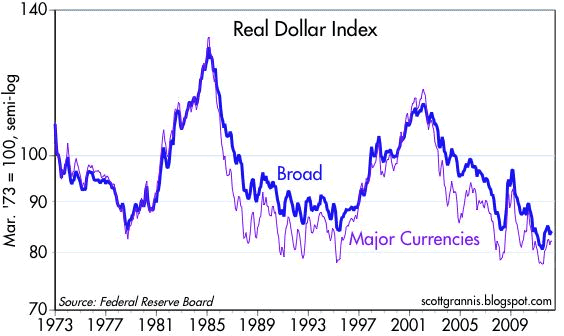
Source: Scott Grannis
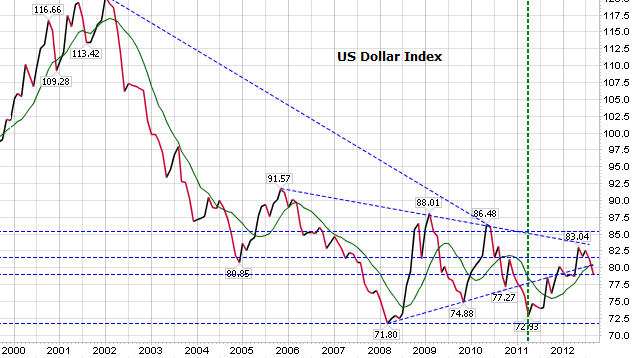
Source: Stockcharts / James Craig
Inflationary monetary policy has become the norm, not just in the US but throughout indebted nations globally. Official US CPI inflation calculations have been gradually changed since the 1980s, but John Williams’ Shadowstats data provides a more consistent picture of inflation over time and reveals that the Federal Reserve has been successful in restoring price inflation since 2008′s deflationary panic. I have used official US stats until 1980, then Shadowstats, to maintain a continuous picture of real US inflation:
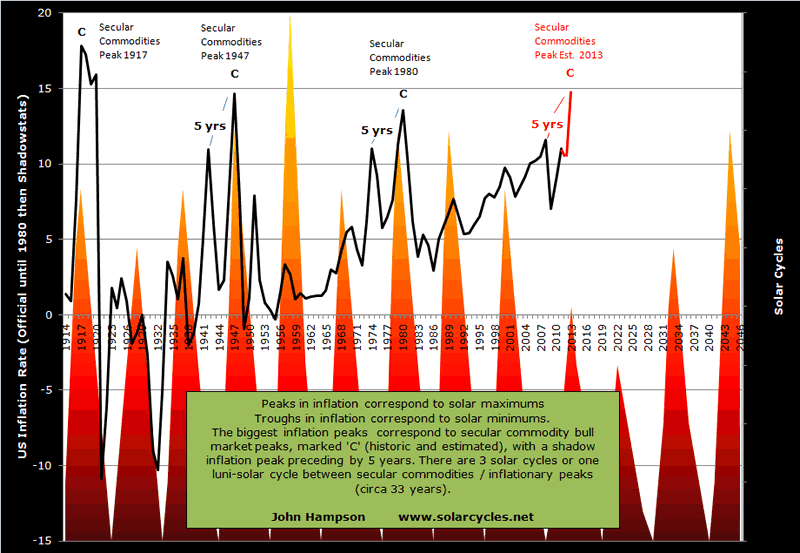
This chart also show the compelling historic relationship with solar cycles.
2013 is forecast to be the solar maximum, and if history repeats, we should see an inflationary peak close to the solar peak. As the chart shows, peaks in inflation correspond to solar maximums and troughs in inflation to solar minimums, historically. The biggest peaks in inflation corresponded to secular commodities peaks, as we might expect due to commodity prices fuelling inflation. These secular commodities peaks all occurred close to the solar maximums, with one luni-solar cycle between each, which is around 33 years. These ultimate peaks in inflation / commodity prices were preceded by a shadow peak 5 years prior.
The last secular commodities peak was 1980. One luni-solar cycle later is 2013. The solar maximum for solar cycle 24 is forecast for 2013, 5 years later than 2008, when we experienced a (shadow) inflation/commodities peak. Drawing together secular, solar and inflation history, I can therefore forecast a secular commodities peak and an inflation peak in 2013. Regular readers know this is a forecast that I have held for some time, and as we close in on the end of 2012, we see increasingly supportive evidence for its fulfillment, as documented above: forthcoming food price inflation from current soft commodity price rises; social conflict from food price inflation; central bank policies of reflation and paper/hard asset revaluations.
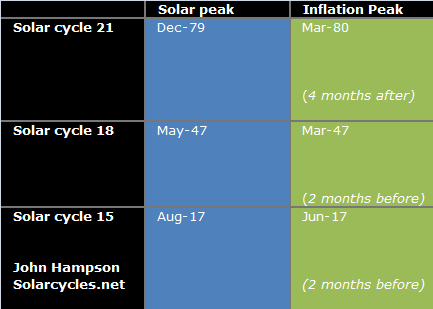
This table shows how close the inflation peaks were in relation to the official solar peaks: between 2 months before and 4 months after.
Currently NASA forecast the solar maximum for around September 2013, whilst SIDC project around March 2013. I expect the difference to be resolved one way or the other as we end 2012, as the sunspot data gradually gives more clues.
From a fundamental perspective, an inflationary peak in 2013 could be justified by a three-way feedback looping between commodities and other commodities, between commodities and conflict, and between commodities and inflation, supported by inflationary monetary policies. From a solar studies perspective, maximum solar activity brings about maximum human biological and behavioural excitability, which manifests as buying, speculation and risk-taking in the markets and economy, and the feedback loops are therefore between solar peaking, secular asset peaking (in this case commodities) and inflationary peaking (speculation into commodities and buying/risk-taking mania). From this alternative perspective, it is the solar maximum of 2013 which is the key driver. Either way, evidence is building towards a fulfillment of an inflationary peak in 2013, and I am positioned accordingly, with my biggest weighting long commodities.
Next: Forecast 2013 Part 2: Secular Commodities Peak
John Hampson, UK / Self-taught global macro trader since 2004
www.solarcycles.net (formerly Amalgamator.co.uk) / Predicting The Financial Markets With The Sun
© 2012 Copyright John Hampson - All Rights Reserved Disclaimer: The above is a matter of opinion provided for general information purposes only and is not intended as investment advice. Information and analysis above are derived from sources and utilising methods believed to be reliable, but we cannot accept responsibility for any losses you may incur as a result of this analysis. Individuals should consult with their personal financial advisors.
© 2005-2022 http://www.MarketOracle.co.uk - The Market Oracle is a FREE Daily Financial Markets Analysis & Forecasting online publication.