Don’t Be a Stock Market Racist, Investing Lesson
InvestorEducation / Learning to Invest Sep 15, 2012 - 10:18 AM GMT There is no shortage of pundits and prognosticators willing to offer their opinions (rarely based on facts) as to whether or not stocks are cheap or expensive, or as to whether the markets are going to rise or fall. In every case, the opinions and prognostications are directed as generalities such as stocks or markets. In this context, the implication is that all stocks are the same, and therefore will all behave in the same manner or in tandem.
In contrast, it has long been our contention that it is a market of stocks and not a stock market. Moreover, we have also long argued in favor of making investing decisions one stock at a time instead of based on views about the general market. In our opinion, general statements about the value of markets or stocks as a class are prejudiced, and therefore we would argue illogical. Making brash and general statements about stocks is analogous to thinking like a racist. The bottom line is that it is just plain wrong thinking.
In truth, individual stocks are as unique and as different as individual human beings. Therefore, just like human beings, individual stocks should be measured and judged based on their own distinctive merit. Consequently, this article is offered to cast a bright light of insight reflecting the truth about investing in individual stocks based on their unique characteristics instead of prejudicial views attempting to paint them all with the same broad brush. Generalizing doesn’t work when evaluating people or common stocks.
The Dow Jones Industrial Average - A Diverse Group of 30 Companies
When people make the general statement that the market is up or down or that stocks are up or down, they are typically referring to either the S&P 500 or even more commonly the 30 Dow Jones Industrial Averages (DJIA). The following CNBC headline is a case in point: “Stocks spiked Thursday, with the Dow jumping 100 points, after the Federal Reserve pulled the trigger on launching a new round of quantitative easing.”
Therefore, this article will look at the index the 30 Dow Jones Industrial Average (DJIA) commonly referred to as the DOW, since it only contains 30 stocks. Nevertheless, we will demonstrate that even such a small universe of stocks contains examples of companies with very diverse characteristics and histories. Thereby, establishing our thesis that it is more relevant to think of a market of stocks than it is a stock market. Like most things, the devil is in the details.
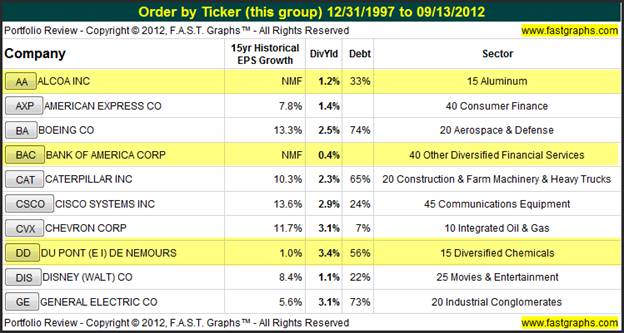
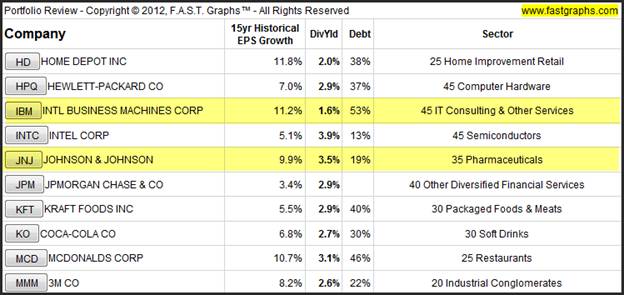
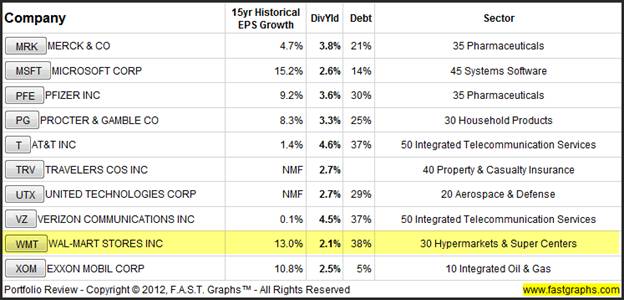
The following tables list the 30 DJIA stocks in alphabetical order and provides a simple snapshot of how diverse each of these individual companies are. The first column shows their historical earnings growth rates, followed by their dividend yields, their debt (note that we do not report debt on financials) and finally their respective sector. These simple metrics alone provide a statistical illustration of how truly different each of these individual “stocks” really are.
Six Specific Examples Representing 20% of the DOW
In addition to the erroneous overgeneralization of the asset class “stocks”, there is another bias that we feel both misleads investors and even keeps them in the dark regarding the pros and cons of investing in equities. Here I’m referring to the fixation on price movement and/or volatility while simultaneously disregarding the fundamentals of the business underpinning the stock. However, we contend that in the long run business results are far more important to investors than short-term price volatility is.
Consequently, we are going to utilize the F.A.S.T. Graphs™ (Fundamentals Analyzer Software Tool) to review 6 of the 30 DOW components, but with a twist. We’re only going to look at them based on earnings and dividends alone. In other words, we are going to exclude stock prices altogether. Our objective is to refocus investors away from the fixation on price and reorient it towards the business behind the stock.
When each company (stock) is looked at from this perspective, the differences between one business and the next are vividly revealed. Due to the inherent volatility of stock prices in an auction market, the common stock price charts of most companies tend to be difficult to differentiate. In other words, from looking at price alone it is hard to impossible to tell much about the business at all. This is where F.A.S.T. Graphs™ distinguish themselves from other graphic programs. Instead of the primary focus being on price, the primary focus is on the business first and price secondary.
Therefore, as you review each of the six sample DOW components below, we suggest that you focus on how different each company’s business results have been (the orange earnings line) and note from the performance tables the impact that these business results have had on long-term performance. We believe that these graphics will make a couple of things quite clear. First, we will be given an instant perspective of just how successful the business has been, and second, the performance results will vividly be reflective of each company’s operating history.
Alcoa, Inc (AA)
Our first example, Alcoa, Inc shows a very cyclical company with no earnings growth (NMF stands for no meaningful figure). Clearly, we can instantly determine that Alcoa has a very unreliable record of earnings growth.
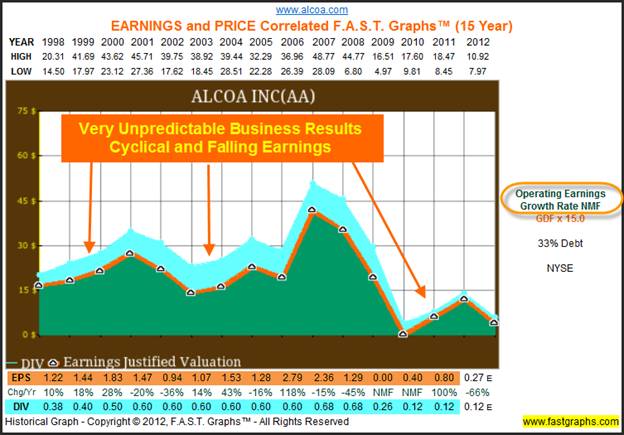
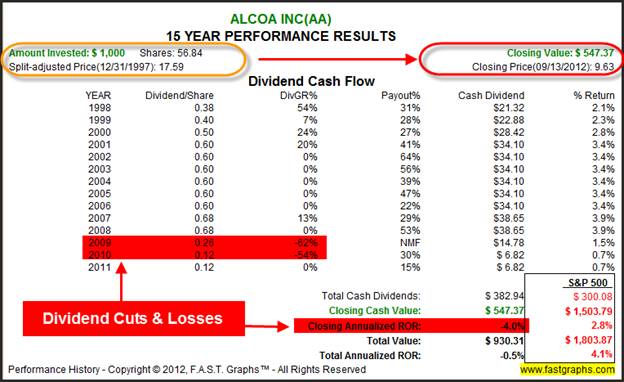
When we examine the performance associated with the above earnings (the orange line) and dividends (the blue shaded area) we should not be surprised to discover a few very important facts. First of all, since 1998 long-term shareholder owners of Alcoa would have lost almost half of their principal. Second, we discover a very unreliable dividend history to include two large cuts in 2009 and 2010.
Johnson & Johnson (JNJ)
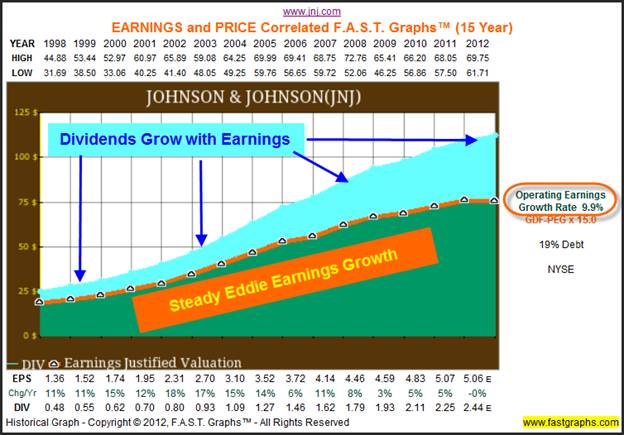
Our second example looks at the blue-chip Johnson & Johnson where we discover a sharp contrast from Alcoa. With this example we see a very steady record of earnings and dividend growth since 1998. However, it should be pointed out that since the great recession Johnson & Johnson’s earnings growth has slowed. Nevertheless, we also see that the dividend has steadily increased with its earnings.
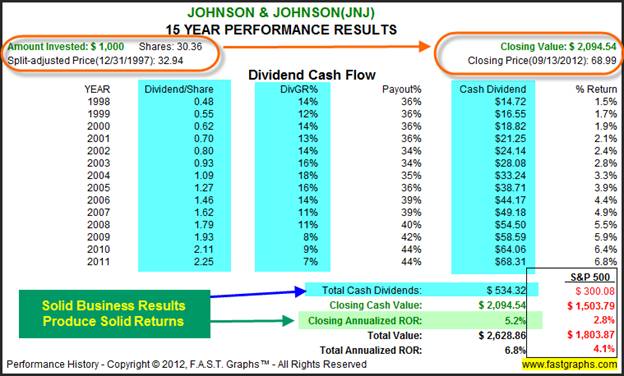
Johnson & Johnson’s better earnings record has produced a steadily rising dividend and an S&P 500 beating return. Clearly, there is very little similarity between the stock Johnson & Johnson and the stock called Alcoa.
Du Pont (DD)
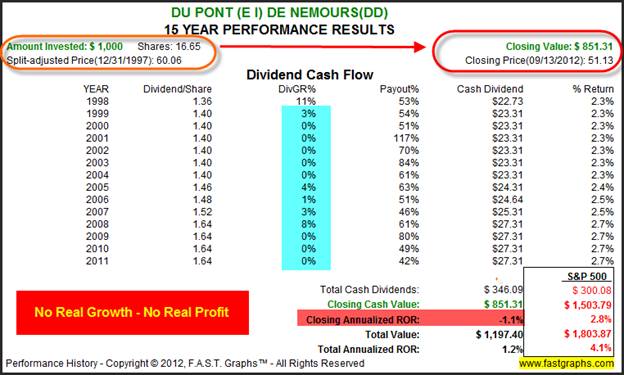
Our third example, Du Pont, shows a company with entirely different characteristics than our first two. With this company, we see not only a high-level of cyclicality, but also very little long-term earnings growth. However, the real point is that DuPont is a very different company than either Alcoa or Johnson & Johnson.
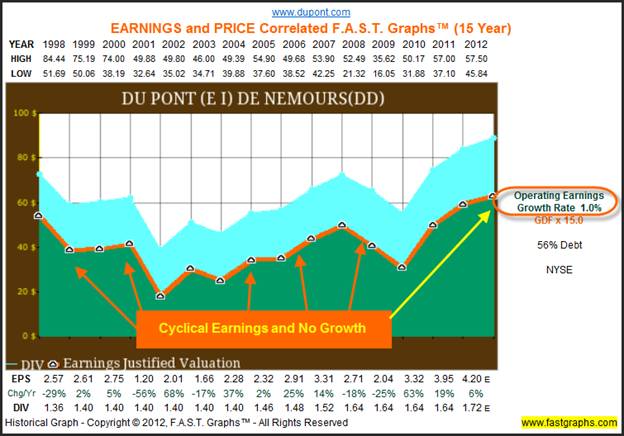
When we review the track record associated with DuPont’s business results, it’s not surprising that dividend growth has been very slow or that long-term capital appreciation has been slightly negative. In other words, inconsistent business results generated inconsistent and rather anemic income and growth as well.
IBM, Inc (IBM)
Our fourth example looks at technology stalwart IBM. Here we see an example of strong earnings growth since 1998. Once again, the point being that there is very little comparison between the business IBM versus the business DuPont. Although both are considered dominant blue chips, IBM is the clear business winner.
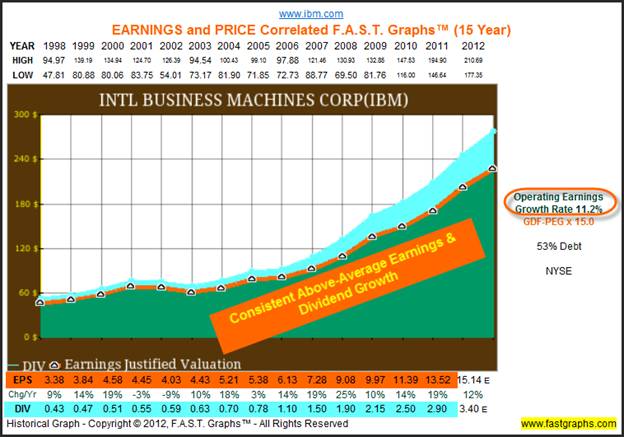
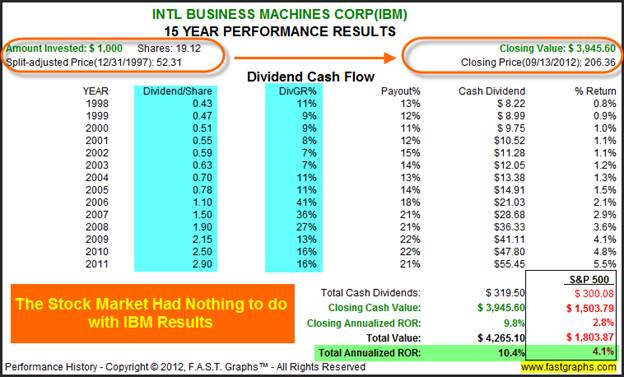
When a company produces the business results that IBM has, it should be of no surprise that its long-term stock performance will follow suit. IBM offers its shareholders a very strong record of dividend growth and capital appreciation that has clearly outperformed the S&P 500 by a wide margin.
Bank of America (BAC)
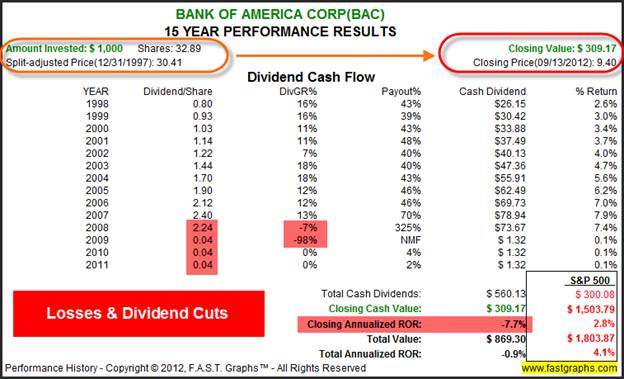
Our fifth example reviews the business results of Bank of America, one of the dreaded mega financials. Clearly, Bank of America’s earnings collapsed as a result of the financial crisis and we might add so did their stock price, although we are not showing it here. The point with showing this high profile company just after we showed IBM is to illustrate the sharp contrast between the business results of these two behemoths.
IBM went through the great recession like it never happened, while Bank of America was decimated. Clearly these two examples vividly illustrate our thesis that it is a market of stocks and not a stock market. This is another way of saying that the stock market had little or nothing to do with the independent results of these two companies. Instead, what mattered most was how each company itself performed as an independent business.
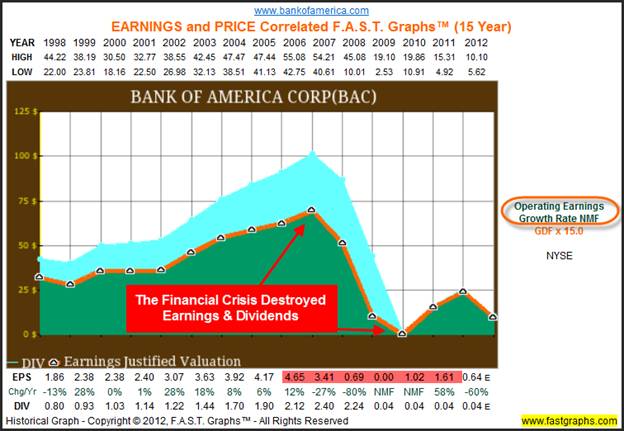
It should be no surprise to the reader that Bank of America was a terrible long-term investment because of its horrific earnings record. Moreover, it should also not be a surprise that their dividend was slashed to almost nothing due to the collapse of its earnings.
Wal-Mart Stores Inc (WMT)
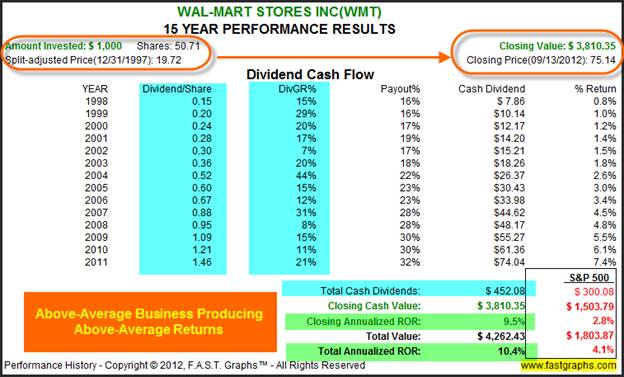
Our sixth and final example reviews Wal-Mart, the world’s largest and arguably greatest retailer. Wal-Mart’s earnings record over this timeframe since 1998 is impeccable and not only distinguishes it amongst its peers, but also amongst most companies. Although there was some short-term volatility along the way, earnings, dividends, and ultimately price, all advanced strongly during, through, and after the great recession of 2008.
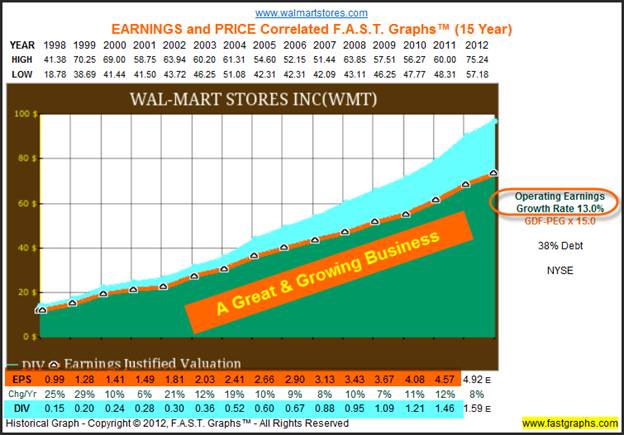
Great operating results translate into great shareholder performance. This is notwithstanding the fact that Wal-Mart was moderately overvalued at the beginning of 1998, became very overvalued by the end of 1999 from where stock price went sideways before once again aligning itself with earnings by the summer of 2007, and has since advanced alongside earnings ever since.
However, regardless of the somewhat irrational nature of its stock price, strong operating results generated an above-average and consistent record of dividend growth in spite of its price action. In the long run, Wal-Mart was a great business that produced great shareholder returns. But most importantly, Wal-Mart was a great business during a time when other businesses like Alcoa, DuPont and Bank of America suffered severe operating challenges.
Don’t Be The Equivalent Of A Stock Market Racist
We are quite often agitated and troubled by the amount of negative sentiment that is placed on stocks. Most of this sentiment is founded on generalities regarding stocks and stock markets. Therefore, our goal in offering this piece is to try and motivate investors to be more discerning regarding investing in equities. Fortunately, we are not alone in our view as it is shared by many of the world’s greatest investors.
Consequently, we will close this article by sharing some famous quotes on this important subject from several of the greatest investors who ever lived. These investing greats have all tried to share their wisdom regarding the undeniable fact that portfolios should be built one company at a time, and again that it is a market of stocks and not a stock market that we should be concerning ourselves with.
Peter Lynch
Our first series of quotes are from Peter Lynch and his best-selling book 'One Up On Wall Street'. Peter makes it quite clear that not only does he not believe in predicting markets but that he also strongly believes in making decisions one company or business at a time.
"I don't believe in predicting markets. I believe in buying great businesses - especially companies that are undervalued, and/or under-appreciated" Peter Lynch 'One Up On Wall Street'
"The stock market ought to be irrelevant. If I could convince you of this one thing, I'd feel this book has done it's job. And if you don't believe me, believe Warren Buffett. "As far as I'm concerned," Buffett has written, "the stock market doesn't exist. It is only there as a reference to see if anybody is offering to do anything foolish." Peter Lynch 'One Up On Wall Street'
Warren Buffett
Legendary investor Warren Buffett also shares a strong conviction against trying to predict markets or even worrying or fussing too much about macroeconomic concerns. We believe that most of what Warren preaches is common sense and that his behavior can be emulated by the general investor if they would only truly listen to his sage advice.
"If we see anything that relates to what's going to happen in Congress, we don't even read it. We just don't think it's helpful to have a view on these matters."
"I never attempt to make money on the stock market. I buy on the assumption that they could close the market the next day and not reopen it for five years."
"(Partner) Charlie (Munger) and I never have an opinion on the market because it wouldn't be any good and it might interfere with the opinions we have that are good."
"If we find a company we like, the level of the market will not really impact our decisions. We will decide company by company. We spend essentially no time thinking about macroeconomic factors. In other words, if somebody handed us a prediction by the most revered intellectual on the subject, with figures for unemployment or interest rates, or whatever it might be for the next two years, we would not pay any attention to it. We simply try to focus on businesses that we think we understand and where we like the price and management."
Marty Whitman
With our next quote we share the opinion of the renowned manager of the successful Third Avenue Value Fund, Marty Whitman, as he explains how much easier it is to forecast a business and its future potential over attempting to forecast stock market behavior. We believe this is a very profound and important piece of wisdom. Why worry about things that you cannot analyze when things that you can are easily available to you.
"I remain impressed with how much easier it is for us, and everybody else who has a modicum of training, to determine what a business is worth, and what the dynamics of the business might be, compared with estimating the prices at which a non-arbitrage security will sell in near-term markets."
Summary and Conclusions
We believe that one of the major forces that distracts otherwise rational people from investing in equities is the emotional response of fear against losses. The great recession of 2008 has caused many people to eschew equities in favor of fixed income at what we believe was precisely the wrong time to behave this way. The real problem is that fear causes people to sell at the bottom when they should be taking advantage of the opportunities presenting themselves instead.
The legendary investor and teacher of most of the modern investor greats, Ben Graham, tried very hard to teach us that a temporary decline in stock prices is an unrealized loss that will generally correct itself if you trust that it will. Moreover, this has always happened after every recession and bear market including our last great one in 2008. However, in order to have the trust, you have to have the wisdom that it requires. First, here is what Ben had to say:
"Every investor should be prepared financially and psychologically for the possibility of poor short-term results. For example, in the 1973-74 decline, the investor would have lost money on paper, but if he held on and stuck with the approach, he would have recouped in 1975-76 and gotten an average 15% return for the five year period." Ben Graham
The following graphic courtesy of Economic Online Tutor provides a history of all of our recessions since the depression of 1929. There are two key points that we believe should be focused on here. First, notice how rare it is for recessions to occur. In fact, over more recent history, recessions have only come around every 6-10 years or so. But second, and most importantly, notice that they don’t really last very long. In other words, better times are much more common and last longer than bad times.
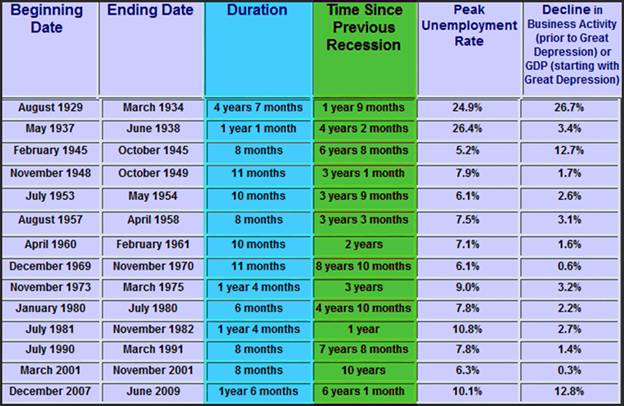
The primary point that we have been postulating in this article is that common stocks are very different and come in all assortments, sizes, shapes and flavors. Consequently, we encourage investors to think more specifically and rely more on the precise characteristics of the individual company or companies they are contemplating. Worrying about the general state of the economy or the stock market, or their future direction, is not only an exercise in futility, but an unnecessary exercise as well.
Finally, we encourage investors to know the companies in their portfolios, and focus more on their businesses and prospects, and worry less about short-term market volatility. In other words, trust the value of the companies you own so you can recognize valuation anomalies as they occur, and therefore, act appropriately. If value is low, add, if value is too high, sell, but never the other way around.
Disclosure: Long CSCO, CVX, HD, HPQ, INTC, JNJ, KFT, KO, MCD at the time of writing.
By Chuck Carnevale
Charles (Chuck) C. Carnevale is the creator of F.A.S.T. Graphs™. Chuck is also co-founder of an investment management firm. He has been working in the securities industry since 1970: he has been a partner with a private NYSE member firm, the President of a NASD firm, Vice President and Regional Marketing Director for a major AMEX listed company, and an Associate Vice President and Investment Consulting Services Coordinator for a major NYSE member firm.
Prior to forming his own investment firm, he was a partner in a 30-year-old established registered investment advisory in Tampa, Florida. Chuck holds a Bachelor of Science in Economics and Finance from the University of Tampa. Chuck is a sought-after public speaker who is very passionate about spreading the critical message of prudence in money management. Chuck is a Veteran of the Vietnam War and was awarded both the Bronze Star and the Vietnam Honor Medal.
© 2012 Copyright Charles (Chuck) C. Carnevale - All Rights Reserved Disclaimer: The above is a matter of opinion provided for general information purposes only and is not intended as investment advice. Information and analysis above are derived from sources and utilising methods believed to be reliable, but we cannot accept responsibility for any losses you may incur as a result of this analysis. Individuals should consult with their personal financial advisors.
© 2005-2022 http://www.MarketOracle.co.uk - The Market Oracle is a FREE Daily Financial Markets Analysis & Forecasting online publication.


