


Gone Since March... the Gold Bull Market Is Officially Back
Commodities / Gold and Silver 2012 Sep 11, 2012 - 12:14 PM GMTBy: DailyWealth

 Dr. Steve Sjuggerud writes: The bull market in gold is 100% back.
Wait, how do we know? What does a bull market in gold look like? And even better... how much money can we make?
Let me answer those questions for you today...
From 2000 to 2011, gold was in an incredible bull market. But after rising for 11 straight years, gold peaked at around $1,900 an ounce in August 2011.
It then fell to around $1,600. And for the last 11 months, gold has been downright boring, drifting around $1,600 an ounce.
But that has changed... Two weeks ago, the Fed essentially told us that it's willing to print more money when needed. This causes the price of gold to rise... You see, when there are more dollars out there, and the same amount of gold, it takes more dollars to buy an ounce of gold.
And gold is finally going up again! It's in an uptrend.
The simplest, most common measure analysts use to gauge when an investment is in a new uptrend is the "200-day moving average."
When a stock (or any other asset) is trading above its average price for the last 200 days, it's in an uptrend.
For the first time since March, gold has risen above its 200-day moving average. So gold is now "officially" in an uptrend. It has been in an uptrend for a couple weeks now, and it appears solid.
Why is an uptrend so significant?
Uptrends are where you make the big money...
Since late 1971, gold has increased at a compound annual rate of 9% a year. But when gold is in an uptrend (when it's trading above the moving average), your wealth compounds at 18% a year.
If you're interested in the actual numbers... we used month-end data instead of daily data to measure this uptrend. This significantly helps limit "false" signals. And we used 10-month moving average as opposed to a 200-day moving average (10 months have roughly 200 business days).
Interestingly, there is nothing magical about the 200-day or 10-month period – the results were similar for eight-month, nine-month, and 11-month moving averages.
Generally, your wealth compounds at about 18% a year (or more) when you own gold when it's above the moving average. That's incredible.
The chart below shows what I mean...
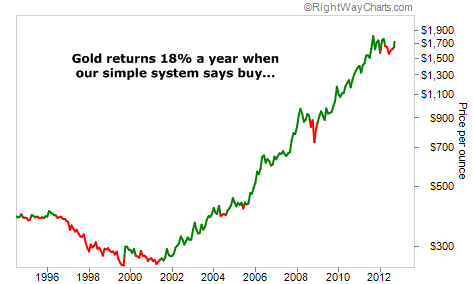
You're "in" the trade when it's green and "out" when it's red. By using this system, you are a little late to get in and a little late to get out. And you'll get an occasional false signal. But generally, it's a pretty darn profitable – and simple – system.
Today, gold is above its 200-day moving average for the first time since March. It has stayed above its moving average for weeks. In short, it appears the gold bull market is back...
This is good news... Going back over 40 years, your wealth compounded at about 18% a year when gold was in a bull market.
If you've been looking for the right time to get back into gold – or add to your position – now is that time...
Gold is in a bull market again. You want to own it now.
Good investing,
Steve
The DailyWealth Investment Philosophy: In a nutshell, my investment philosophy is this: Buy things of extraordinary value at a time when nobody else wants them. Then sell when people are willing to pay any price. You see, at DailyWealth, we believe most investors take way too much risk. Our mission is to show you how to avoid risky investments, and how to avoid what the average investor is doing. I believe that you can make a lot of money – and do it safely – by simply doing the opposite of what is most popular.
Customer Service: 1-888-261-2693 – Copyright 2011 Stansberry & Associates Investment Research. All Rights Reserved. Protected by copyright laws of the United States and international treaties. This e-letter may only be used pursuant to the subscription agreement and any reproduction, copying, or redistribution (electronic or otherwise, including on the world wide web), in whole or in part, is strictly prohibited without the express written permission of Stansberry & Associates Investment Research, LLC. 1217 Saint Paul Street, Baltimore MD 21202
Disclaimer: The above is a matter of opinion provided for general information purposes only and is not intended as investment advice. Information and analysis above are derived from sources and utilising methods believed to be reliable, but we cannot accept responsibility for any losses you may incur as a result of this analysis. Individuals should consult with their personal financial advisors.
Daily Wealth Archive
|
© 2005-2022 http://www.MarketOracle.co.uk - The Market Oracle is a FREE Daily Financial Markets Analysis & Forecasting online publication.