


Forex, Financial and Commodity Markets Shackles broken
Stock-Markets / Financial Markets 2012 Sep 11, 2012 - 01:58 AM GMTBy: Capital3X

 The title of the post should have conveyed my thoughts. The shackles on ES and copper and AUDUSD and AUDJPY have been broken. Same for bond markets. There seems to be perfect harmony between the inter markets and this is where it gets safer to trade. Some weeks like last are difficult. Some weeks like the one coming could be easier to trade. But that is matter of perspective and hence treat all weeks similar.
Time to look at all those detailed analysis and charts. Make sure you roll down to the end of the post read the summary as well.
There are many ways to trade. You can read those bearish blogs around the internet and waste your entire money by buying Gold and silver and selling equities. But there is a smarter class of traders who make money in all cycles. It does not matter whether market is going up or down. To them it is just a matter of probability and mathematical skills. This is where we specialize. We do read the fundamental analysis available and all the bearish charts on the end of FED and ECB and so on and so forth. But we do not trade on that advice. So here in attached our analysis and charts for the readers of marketoracle.
But before we get into the analysis and charts, here is an important link for those interested in linking their forex accounts with our in an automated fashion allowing you to replicate trade by trade.
The feedback on the trade copier has been outstanding and exceeding our initial issues with it. But unfortunately the copier is only open to Capital3x subs.
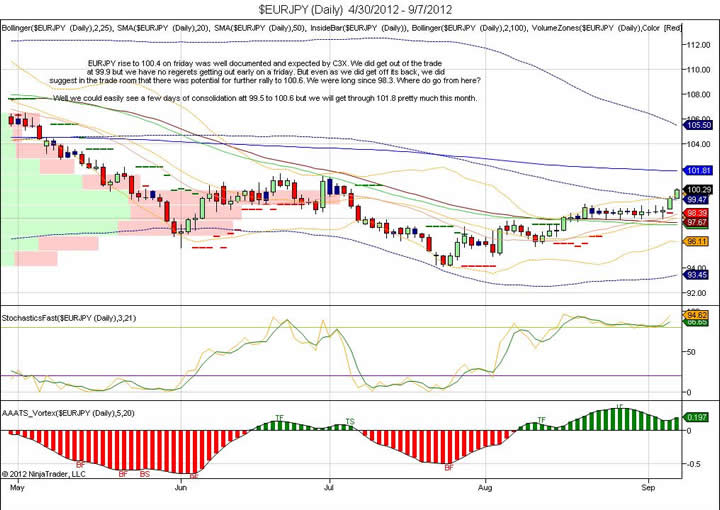
EURJPY rise to 100.4 on friday was well documented and expected by C3X. We did get out of the trade
at 99.9 but we have no regerets getting out early on a friday. But even as we did get off its back, we did
suggest in the trade room that there was potential for further rally to 100.6. We were long since 98.3. Where do go from here? Well we could easily see a few days of consolidation att 99.5 to 100.6 but we will get through 101.8 pretty much this month. The 101.6 levels marks the 3 M high and hence a critical breakout level. Consider to be a level as important as a Netline buy. If you get a closing above 101.6 we could further push up for another 100 pips very fast.
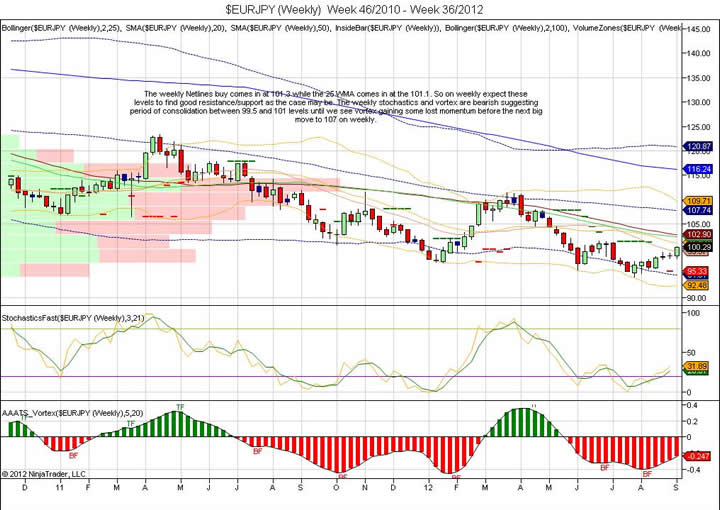
The weekly Netlines buy comes in at 101.3 while the 25 WMA comes in at the 101.1. So on weekly expect these levels to find good resistance/support as the case may be.
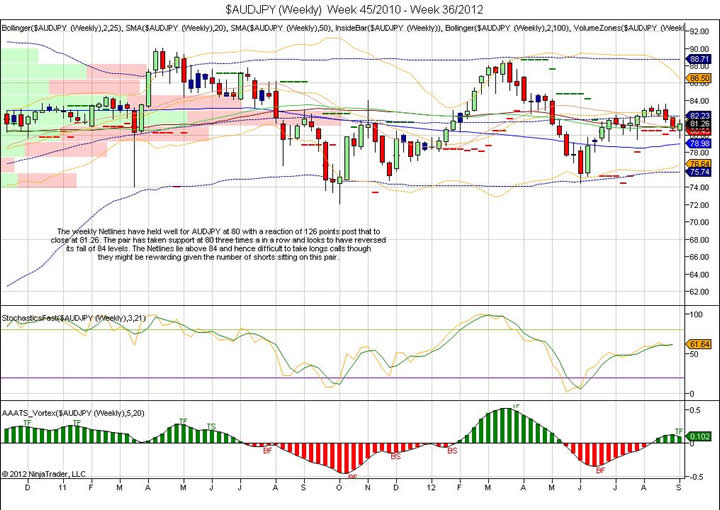
The weekly Netlines have held well for AUDJPY at 80 with a reaction of 126 points post that to close at 81.26. The pair has taken support at 80 three times a in a row and looks to have reversed its fall of 84 levels. The Netlines lie above 84 and hence difficult to take longs calls though they might be rewarding given the number of shorts sitting on this pair.
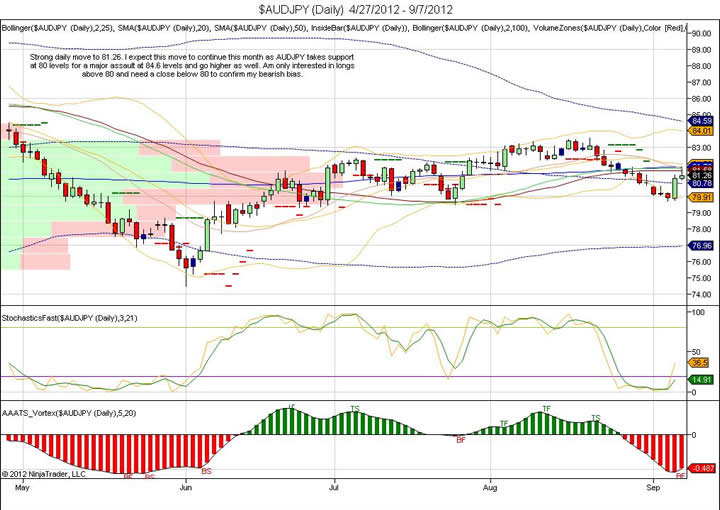
Strong daily move to 81.26. I expect this move to continue this month as AUDJPY takes support at 80 levels for a major assault at 84.6 levels and go higher as well. Am only interested in longs above 80 and need a close below 80 to confirm my bearish bias.
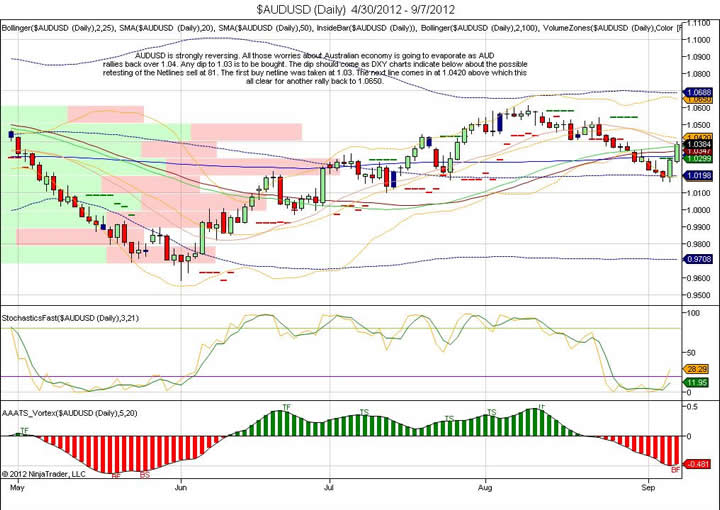
AAUDUSD is strongly reversing. All those worries about Australian economy is going to evaporate as AUD
rallies back over 1.04. Any dip to 1.03 is to be bought. The dip should come as DXY charts indicate below about the possible retesting of the Netlines sell at 81. The first buy netline was taken at 1.03. The next line comes in at 1.0420 above which this all clear for another rally back to 1.0650.
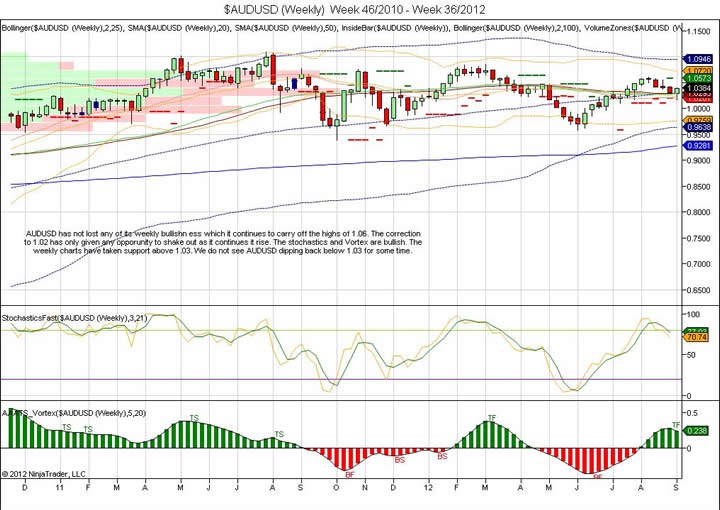
AUDUSD has not lost any of its weekly bullishn ess which it continues to carry off the highs of 1.06. The correction to 1.02 has only given any opporunity to shake out as it continues it rise. The stochastics and Vortex are bullish. The weekly charts have taken support above 1.03. We do not see AUDUSD dipping back below 1.03 for some time.
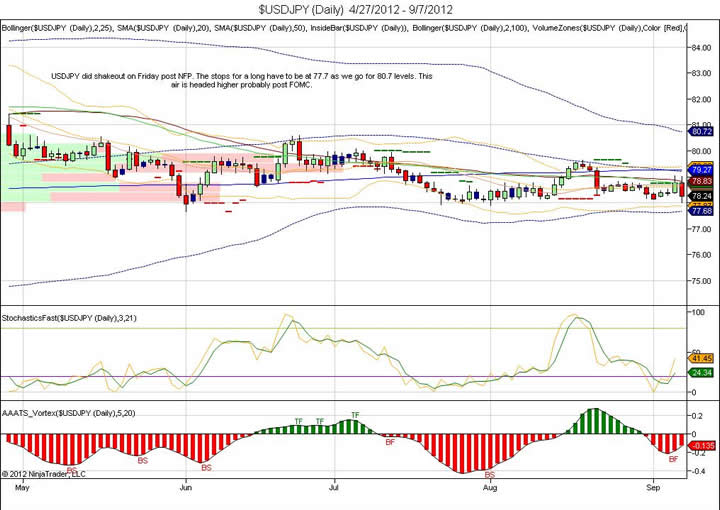
USDJPY did shakeout on Friday post NFP. The stops for a long have to be at 77.7 as we go for 80.7 levels. This air is headed higher probably post FOMC.
A three month low for dollar. That is a clear sell at 81. Trades dont come easier than this. The easy move is over. Wait for a retrace to 81 to re short the dollar.
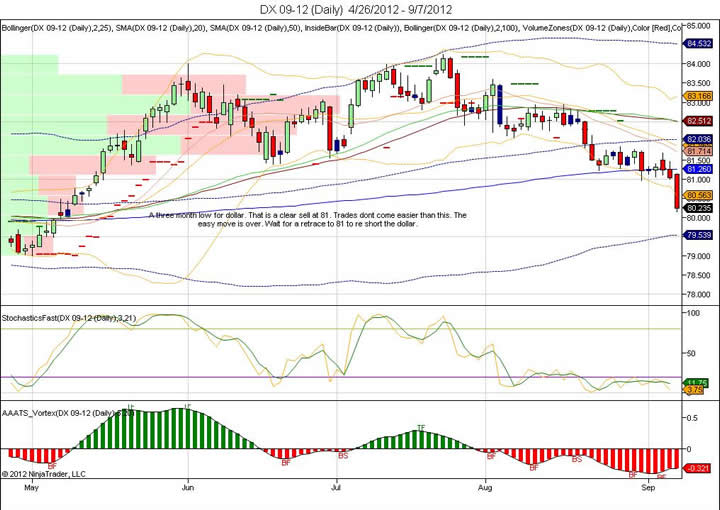
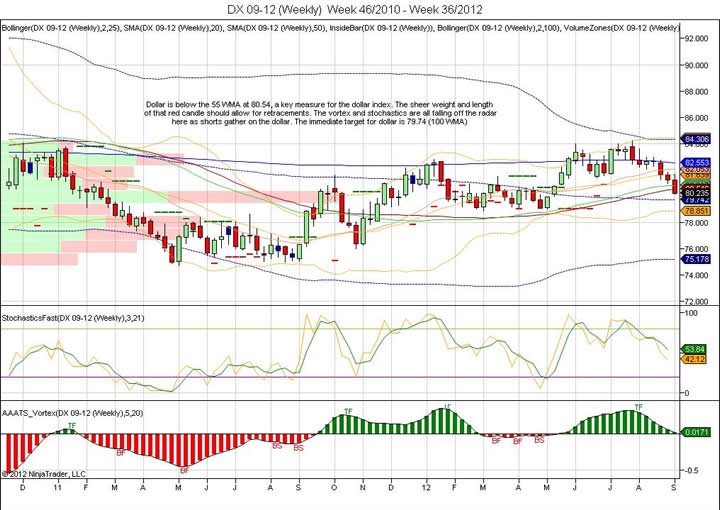
Dollar is below the 55 WMA at 80.54, a key measure for the dollar index. The sheer weight and length of that red candle should allow for retracements. The vortex and stochastics are all falling off the radar
here as shorts gather on the dollar. The immediate target for dollar is 79.74 (100 WMA).

A 2012 high and brushing the upper bollinger for 100 week. Whats more interesting is the 25 upper weekly
too comes in at 1439. Very interesting times as bulls are now powering their way but they better have enough ammunition here to overpower shorts at such critical inflexion points.
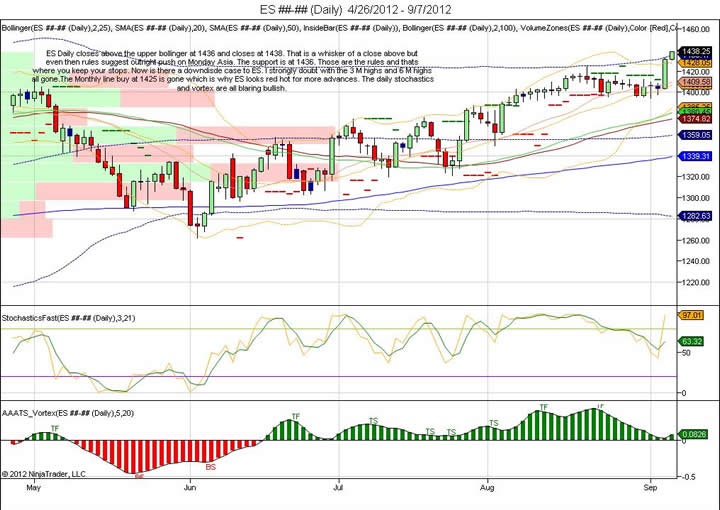
ES Daily closes above the upper bollinger at 1436 and closes at 1438. That is a whisker of a close above but even then rules suggest outright push on Monday Asia. The support is at 1436. Those are the rules ……..nd thats where you keep your stops. Now is there a downdisde case to ES? I strongly doubt with the 3 M highs and 6 M highs all gone.The Monthly line buy at 1425 is gone which is why ES looks red hot for more advances. The daily stochastics and vortex are all blaring bullish.
Bond Markets
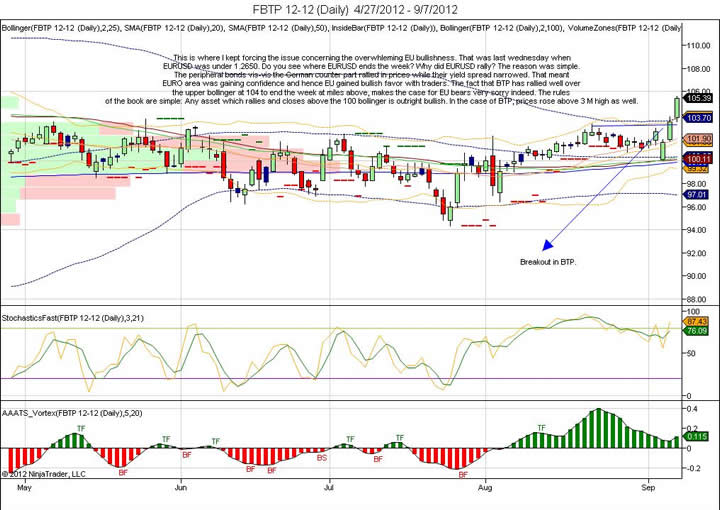
This is where I kept forcing the issue concerning the overwhleming EU bullishness. That was last wednesday when EURUSD was under 1.2650. Do you see where EURUSD ends the week? Why did EURUSD rally? The reason was simple. The peripheral bonds vis-vis the German counter part rallied in prices while their yield spread narrowed. That meant EURO area was gaining confidence and hence EU gained bullish favor with traders. The fact that BTP has rallied well over the upper bollinger at 104 to end the week at miles above, makes the case for EU bears very sorry indeed. The rules of the book are simple: Any asset which rallies and closes above the 100 bollinger is outright bullish. In the case of BTP, prices rose above 3 M high as well.
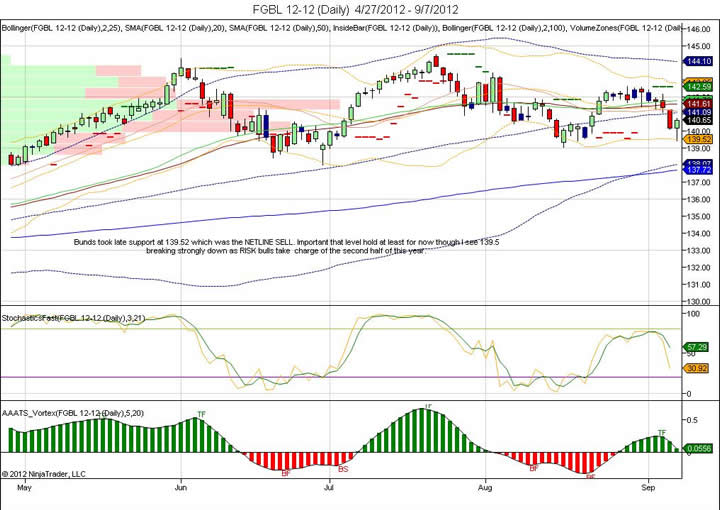
Bunds took late support at 139.52 which was the NETLINE SELL. Important that level hold at least for now though I see 139.5 breaking strongly down as RISK bulls take charge of the second half of this year.
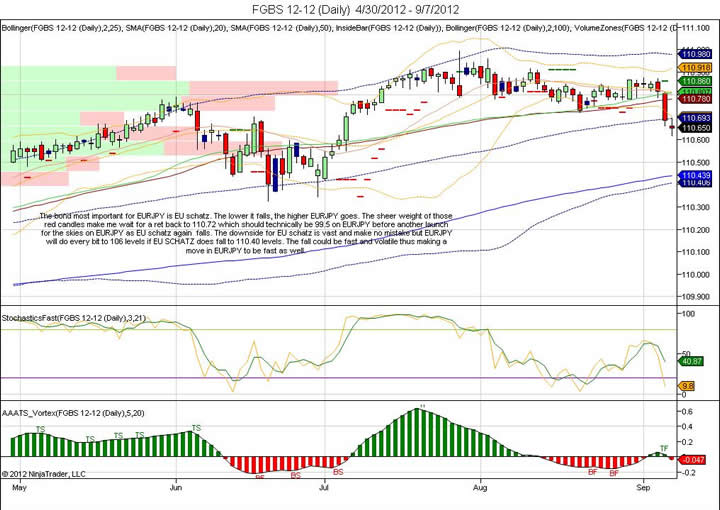
The bond most important for EURJPY is EU schatz. The lower it falls, the higher EURJPY goes. The sheer weight of those red candles make me wait for a ret back to 110.72 which should technically be 99.5 on EURJPY before another launch for the skies on EURJPY as EU schatz again falls. The downside for EU schatz is vast and make no mistake but EURJPY will do every bit to 106 levels if EU SCHATZ does fall to 110.40 levels. The fall could be fast and volatile thus making a move in EURJPY to be fast as well.
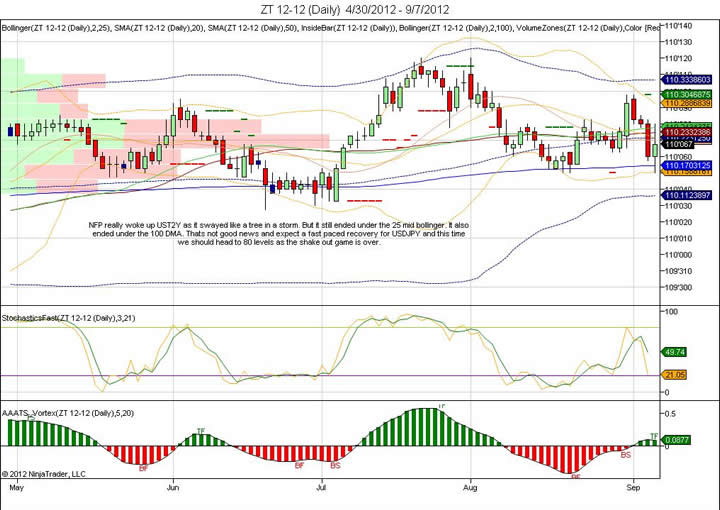
NFP really woke up UST2Y as it swayed like a tree in a storm. But it still ended under the 25 mid bollinger. It also ended under the 100 DMA. Thats not good news and expect a fast paced recovery for USDJPY and this time we should head to 80 levels as the shake out game is over.
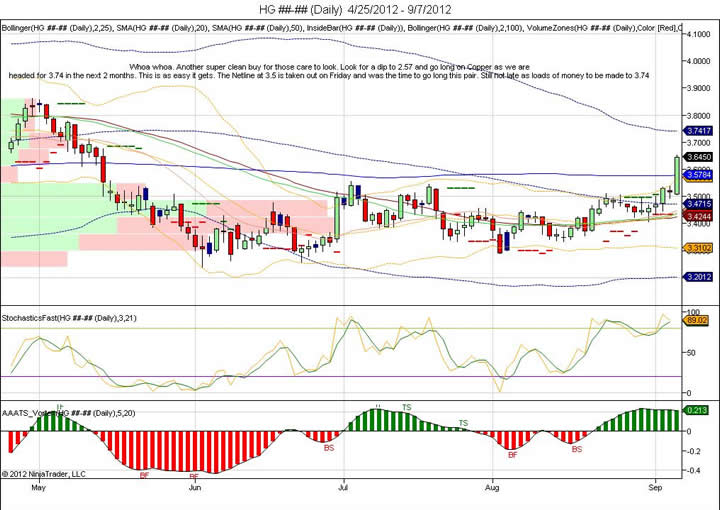
Whoa whoa. Another super clean buy for those care to look. Look for a dip to 2.57 and go long on Copper as we are headed for 3.74 in the next 2 months. This is as easy it gets. The Netline at 3.5 is taken out on Friday and was the time to go long this pair. Still not late as loads of money to be made to 3.74.
Other charts
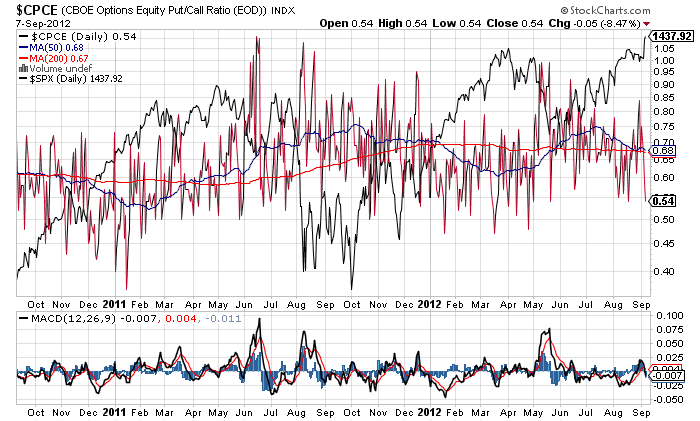
The put call ratio on SPX is at a healthy 0.54. No worries here either for any kind of overstretched SPX. At 1438, it is not “overbought” if I may use that word only in relation to the option market.
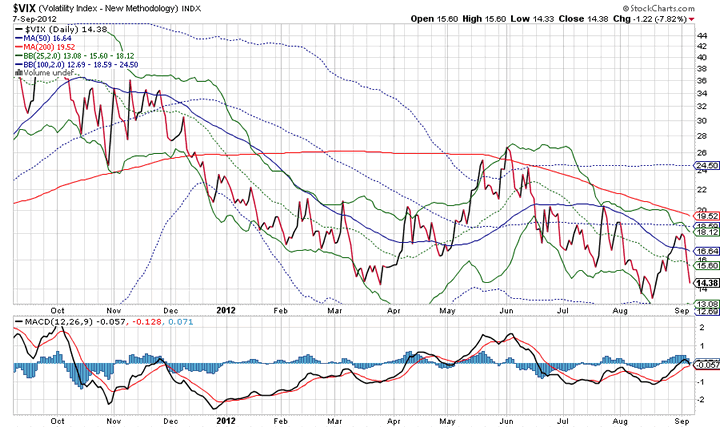
VIX turns down from just under the upper 25 bollinger and once again headed down. Will it this time break single digits?
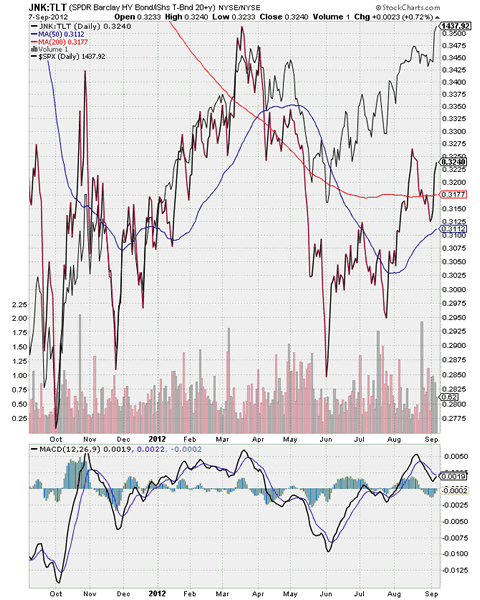
JNK/TLT ratio well on its way but it has been lagging SPX which does make me wonder if the latest rally on SPX is a QE expectation rally or is there a much more stronger reason. The ratio is purely a ratio of junk vs safety. In bull markets, junk rises in prices as money flows out of safety into higher yield asset. The fact that this ratio is still not at 2012 highs is a potential red flag to some concerns.
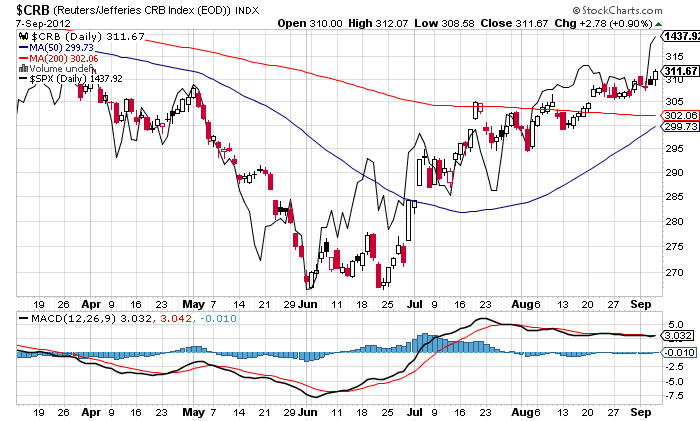
The commodity band wagon is beautifully shaping up and complementing SPX.
Summary: Over 25 charts and analysis later, the bullish bias on risk markets are pretty clear. The shackles have been broken. Energy released. As you ponder charts on Copper, Gold, ES, EU Bunds, EU schatz, BTP (Italian bonds) and UST 2 year bonds, the feeling is unanimous. There is a lot more for this risk train to travel before it will give any chance to the bears to get on.
We at Capital3x have a far more difficult job than any other forex firm or analyst. They all act as pseudo advisers and conduct grand CNBC interviews to say how they were spot on with NFP and guessing ECB bond buying. But not one had the ability to guess that EU was going to blow out 1.28 on friday. Yes there was one out there at 1.278 when he said “maybe 1.283″. But come over to the private trade room of Capital3x and you will see Thursday chat “EURUSD 1.283 coming”. We also said EURJPY to 101.3 which of course is still pending. That was 24 hours before when not one forex analyst had it in their radar. So these pseudo analysts can say what they want. But to actually put it in trading is a far different ball game. That is why we search across charts and assets to see if we have missed anything. This is how we have worked from the day of our inception. That is the reason why we work so hard and hopefully we will make you work as hard by keeping you awake to go through all these charts.
Let me remind you: It is not enough to look at one single chart for EURUSD and trade EURUSD. You need to look at all its linkages esp from the bond markets. Its amateurish to just draw a few lines and % retracement alone to trade EURUSD.
In other news, we continue to be live with the TRADE COPIER. If you only need a basic C3X membership then you can have it here: Captial3x membership here
Capital3x also has been doing very well with forex indicators which work like a charm in a market which is ready to make a major trend. Read it here what it did on Thursday. On Friday it was even better and am sure who were using will know it.
Our feeds: RSS feed Our Twitter: Follow UsKate Capital3x.com Kate, trading experience with PIMCO, now manage capital3x.com. Check performance before you subscribe.
© 2012 Copyright Capital3X - All Rights Reserved
Disclaimer: The above is a matter of opinion provided for general information purposes only and is not intended as investment advice. Information and analysis above are derived from sources and utilising methods believed to be reliable, but we cannot accept responsibility for any losses you may incur as a result of this analysis. Individuals should consult with their personal financial advisors.
© 2005-2022 http://www.MarketOracle.co.uk - The Market Oracle is a FREE Daily Financial Markets Analysis & Forecasting online publication.