


Progression of Stock Market Top, Crash Formations
Stock-Markets / Financial Crash Sep 07, 2012 - 06:16 AM GMT

 SPX shows a well-formed Orthodox Broadening Top formation that may have a few points left to complete point 5. As it stands, it is already overbought and has the minimum requirements for a completed formation. The trading bands have squeezed together suggesting a violent transition is at hand.
Once the SPX declines below 1395, there is a good possibility of a bounce from the 50-day moving average (point 6) back to mid-Cycle resistance at 1410.27 (point 7), then a very dramatic decline to its average target of 1074.15, its 2011 low.
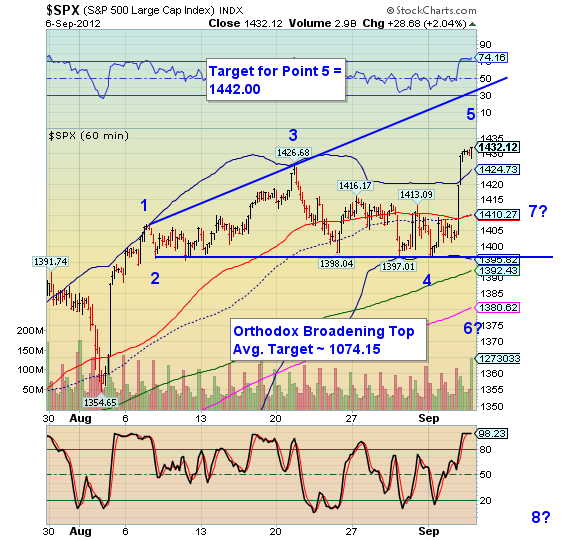
The Orthodox Broadening Top has a failure rate of only 4% once the lower trendline is broken. The average decline for these formations is 23% from the lower trendline. But wait…there’s more!
The Orthodox Broadening Top shown in the hourly chart is a grandchild of even larger Broadening top formations. The parent (red) to the first formation started from the June 4 low and has a slightly higher target of 1096.00. Wedges can be crash formations, but have an average decline of 20% once the lower trendline is broken.
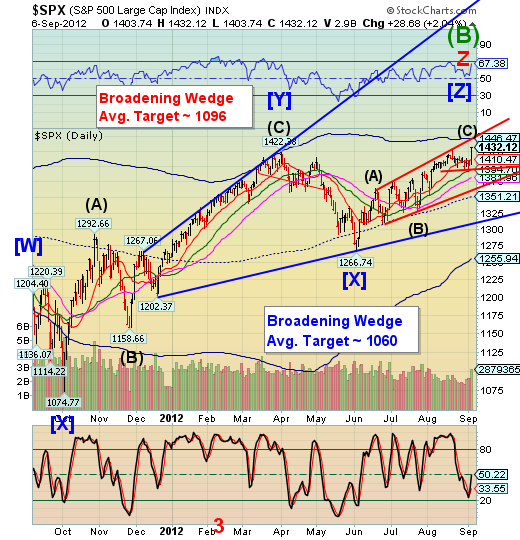
Then there is the grandparent (blue) that started fat the November 25, 2011 low. The grandparent formation has a deeper target than the prior two formations and may also challenge the 2011 lows. Broadening Wedges have only a 6% failure rate once the lower trendline is broken. You can see that I have been patiently waiting for these trendlines to break for an awfully long time. I refer to these as crash triggers.
But there’s even more…
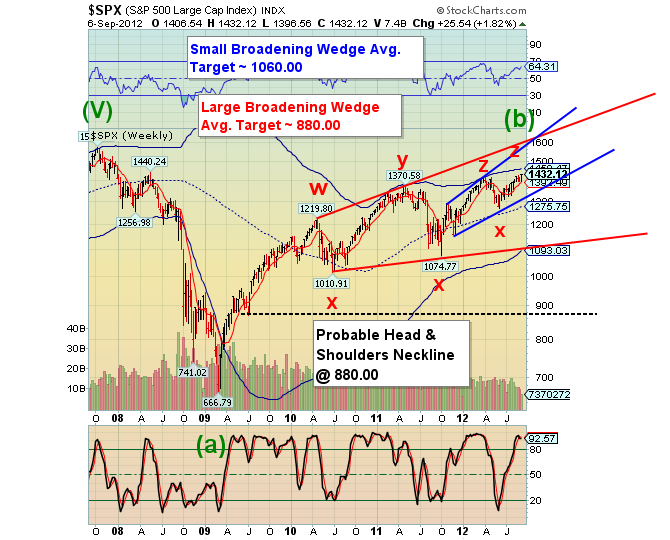
The great-grand-daddy of them all started at the February 2010 low, leading up to the first Flash Crash. It has a probable target near 880.00.
You will notice that I have drawn a probable neckline for a massive Head & Shoulders formation at 880.00. The July 12, 2009 low was 869.32. It is entirely possible, nay, probable that Cycle wave I may reach 880.00. I envision this target to be the terminus for Cycle Wave I. It is likely that, once the crash triggers are broken on each formation, there will be a “waterfall” decline to the next formation, and so on, until the decline is exhausted.
I’ll let you figure the target for the Head & Shoulders formation. It is even more massive than the first decline, since it will be some multiple of the initial decline.
This makes a fascinating fractal study, since fractals are often self-similar repetitions of one another. By the way, there is a great-great-grand-daddy broadening Wedge on the monthly charts. Why don’t you see if you can locate it.
Regards,
Tony
Our Investment Advisor Registration is on the Web
We are in the process of updating our website at www.thepracticalinvestor.com to have more information on our services. Log on and click on Advisor Registration to get more details.
If you are a client or wish to become one, please make an appointment to discuss our investment strategies by calling Connie or Tony at (517) 699-1554, ext 10 or 11. Or e-mail us at tpi@thepracticalinvestor.com .
Anthony M. Cherniawski, President and CIO http://www.thepracticalinvestor.com
As a State Registered Investment Advisor, The Practical Investor (TPI) manages private client investment portfolios using a proprietary investment strategy created by Chief Investment Officer Tony Cherniawski. Throughout 2000-01, when many investors felt the pain of double digit market losses, TPI successfully navigated the choppy investment waters, creating a profit for our private investment clients. With a focus on preserving assets and capitalizing on opportunities, TPI clients benefited greatly from the TPI strategies, allowing them to stay on track with their life goals
Disclaimer: The content in this article is written for educational and informational purposes only. There is no offer or recommendation to buy or sell any security and no information contained here should be interpreted or construed as investment advice. Do you own due diligence as the information in this article is the opinion of Anthony M. Cherniawski and subject to change without notice.
Anthony M. Cherniawski Archive |
© 2005-2022 http://www.MarketOracle.co.uk - The Market Oracle is a FREE Daily Financial Markets Analysis & Forecasting online publication.