The U.S. Consumer Has In Fact Changed
Economics / US Economy Sep 02, 2012 - 04:50 PM GMTBy: Tony_Pallotta
 The consumer represents 70% of total economic output. So as the bond market is to the capital market, so is the consumer to the economy. When the consumer sneezes, the economy catches more than just a cold.
Since the "end" of the 2008 recession something very interesting has happened to the US economy. The US consumer has actually changed their spending habits. They have actually started to live more within their means. And that is a very positive sign for a number of reasons both financially and socially.
Yet it has been masked by one very dangerous action. As the US consumer has pulled back the government has tried to make up the difference through an explosion in government debt.
The charts may point to income growth, showing the consumer is fully recovered from the great recession. But they are misleading.The consumer is in damage control mode. It is government spending which has fueled this growth, a misleading term. It is this explosion in debt that is masking the truly fundamental and structural shift in the economy.
Here is a simple back of the envelope calculation of how masked this change to the economy is.
Total consumer spending increased 15.6% since Q1 2007
In January 2007 the consumer contributed 9.6 trillion or 70% of total GDP.
In June 2012 the consumer contributed 11.1 trillion or 71.2% of total GDP.
Total wages increased 9.5% since Q1 2007
In January 2007 wages and salaries were 54.3% of total income
In June 2012 wages and salaries were 51.5% of total income
Assuming consumer spending growth matched wage growth of 9.5% then Q2 2012 GDP would be reduced by 600 billion or 3.8%. Meaning the US economy contracted by over 2%.
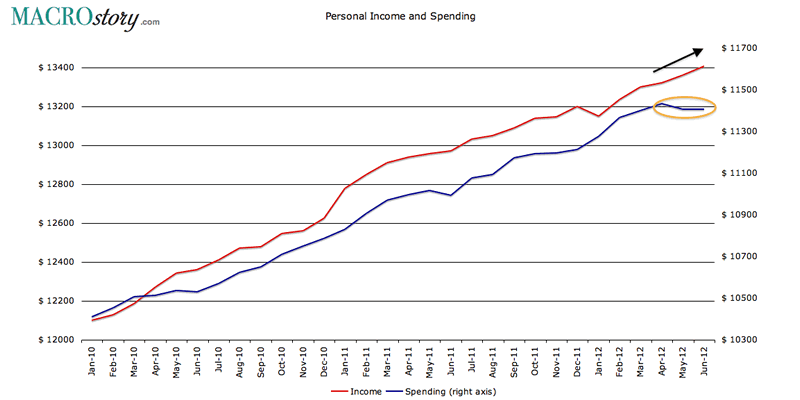
Income Versus Spending
On the surface this chart looks great. Though spending has leveled off, the growth in income "should" calm any concerns about the consumer. It should also indicate that the recent plateau in spending is temporary or shall I say "transitory."

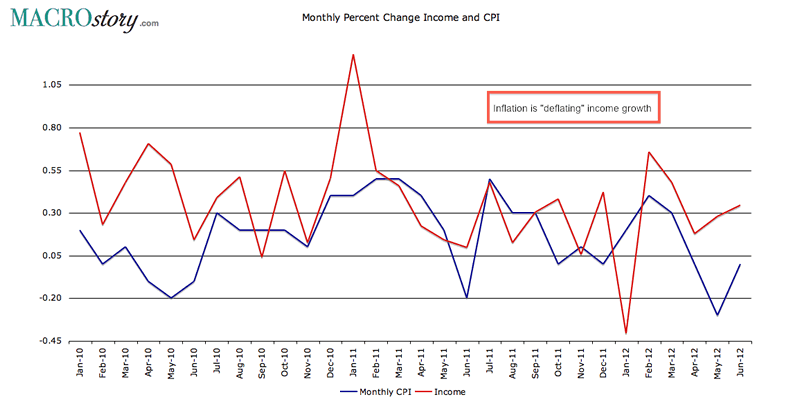
Inflation Is Deflating Income Growth
If you have a fixed budget and all of a sudden something you have to buy goes up in price the impact is simple. You are forced to buy less of those items that are non-essential. This is where the above chart begins to not look so good.
When you compare income growth to monthly CPI there is no growth in real (inflation) adjusted income to buy more. And when items like food and gas rise, it means the demand for discretionary items must fall. And perhaps that is why spending is leveling off.

The Conservative Consumer
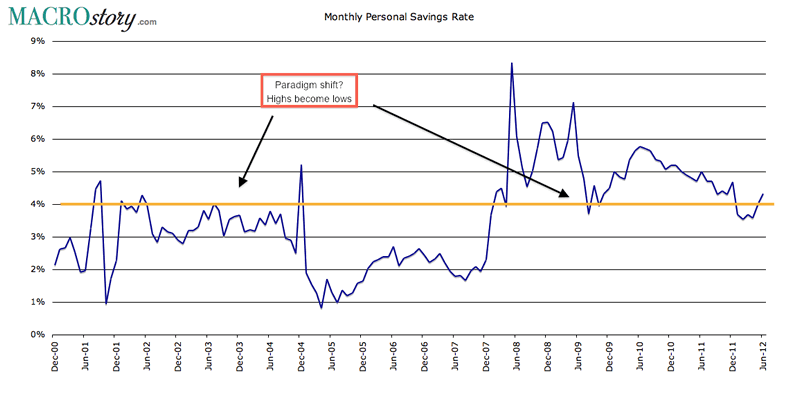
Philadelphia Fed President, Charles Plosser gave a great interview on CNBC recently where he specifically pointed out how the consumer since the 2008 recession is not interested in spending more. They do not want to lever back up and that is exactly what the Federal Reserve is trying to force them to do with ZIRP (zero interest rate policy). This chart confirms what the lone Fed dissenter says.
This is good news is repairing their balance sheet. With the loss of wealth due to housing the consumer is in damage control mode. Notice how 4% had been the highest the savings rate would reach pre-recession as consumers were in spend mode. Now notice as they are in defensive mode how 4% has become the lowest.

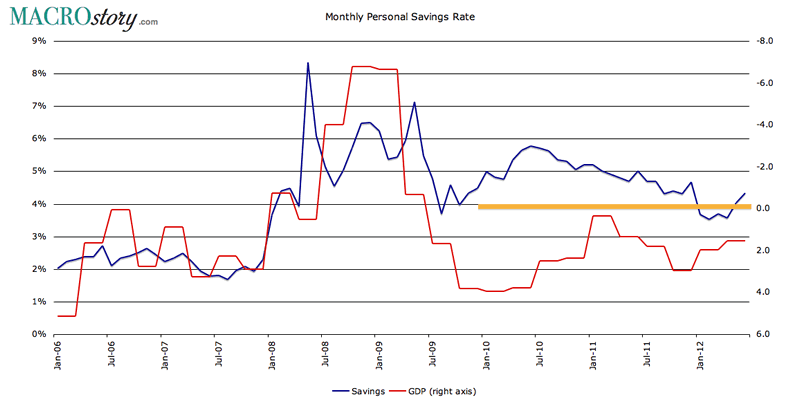
The Savings Rate And GDP
So if in fact the consumer has shifted their spending habits. And what was the upper limit in the savings rate is now the lower limit, then the following chart is very concerning.
The chart would say the US has been in or flirting with recession since 2010 based purely on a simple comparison with the savings rate. If the savings rate is high, the consumer is spending less. And if 70% of the economy is not expanding then neither is the economy.

Bottom Line
The Fed may have changed the psyche of the investor convincing them not to fear lower equity prices but the economy has changed the psyche of the consumer. And that is a good thing. The consumer is in damage control mode and even the dangling of very cheap credit, the drug that gets all of us in trouble is not working. The consumer is saying "no mas." And yet the Fed is not getting the message.
At least Charles Plosser is.
By Tony Pallotta
Bio: A Boston native, I now live in Denver, Colorado with my wife and two little girls. I trade for a living and primarily focus on options. I love selling theta and vega and taking the other side of a trade. I have a solid technical analysis background but much prefer the macro trade. Being able to combine both skills and an understanding of my "emotional capital" has helped me in my career.
© 2012 Copyright Tony Pallotta - Disclaimer: The above is a matter of opinion provided for general information purposes only and is not intended as investment advice. Information and analysis above are derived from sources and utilising methods believed to be reliable, but we cannot accept responsibility for any losses you may incur as a result of this analysis. Individuals should consult with their personal financial advisors.
© 2005-2022 http://www.MarketOracle.co.uk - The Market Oracle is a FREE Daily Financial Markets Analysis & Forecasting online publication.


